
Most Everyone Is Bearish On Equities Except Companies
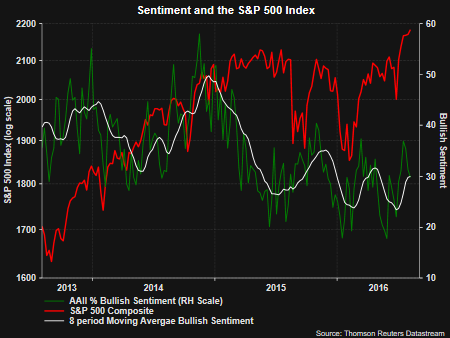
Last Friday the S&P 500 Index closed at its daily high of 2,182.87 and this equated to a 20.6% advance since the February 11th intra-day low. In spite of this strong advance from the February low and a price only return of 6.8% this year, most investors remain bearish on stocks.
- This bearishness has translated into equity outflows of mutual funds and ETFs with bond investments capturing much of the inflows.

Source: ICI
- Foreign investors have been net sellers of equities since 2014. In 2014 they reduced equity investments by $16.1 billion, in 2015 reduced equities by $114.9 billion and year to date through May reduced equities by $34.2 billion.

Source: Federal Reserve
- individual investor bullish sentiment remains at a low level as reported by AAII.
This bearish action by investors is occurring at a time when economic data is coming in better than expected, not only in the U.S., but in the euro zone as well. The two charts below show the Citigroup economic surprise index for both the U.S. and the euro zone has turned positive after remaining in negative territory for over a year in the U.S. and almost a year for the euro zone. In brief the CESI measures actual release data versus its forecast. As a result, readings above zero indicate more of the data is better than actual forecast. A more detailed view of the CESI can be found here.


Additional economic and fundamental data are trending favorably as well.
- Strength in job openings report
- Positive earnings revision ratio
- Strong uptrend in NYSE advance/decline line


Given the level of equity market negativity and importantly, the out flows from equities, what is driving stock prices higher? A significant factor is strong corporate stock buyback activity. Buyback volume has been far in excess of investor equity outflows.
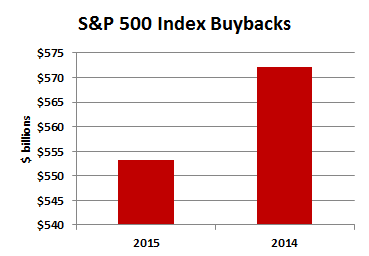
Source: S&P Dow Jones Indices
Lastly, in a recent report by Richard Bernstein, Rabidly Risk Averse, and a worthwhile read, he notes,
For nearly 30 years, we have surveyed Wall Street strategists for their recommended equity allocation. Through time this survey has shown to be a very reliable long-term sentiment indicator. In other words, it has historically been bullish when Wall Street suggested underweighting equities and bearish when they suggested overweighted positions.
- Wall Street recommended underweighting equities throughout most of the bull market of the 1980s and 1990s. This represents the proverbial “wall of worry” that existed throughout that secular bull market.
- Wall Street recommended overweighting equities in 1999/2000 just prior to the “lost decade in equities”.
- Wall Street again favored equities prior to the 2007/8 bear market.
- Most important, strategists have been again recommending an underweight of equities throughout the current bull market.
In summary, investors do not seem to be 'all-in' on equities in spite of an improving economic environment as well as improving corporate fundamentals. This broad level of market skepticism suggests there remains more available demand for equities and a market that continues to 'climb a wall of worry.' The strength of the advance from the February low does suggest some consolidation of recent gains is probable and healthy.
Disclosure: None.


Corporations are buying back to prop their stock prices not because they are bullish.