
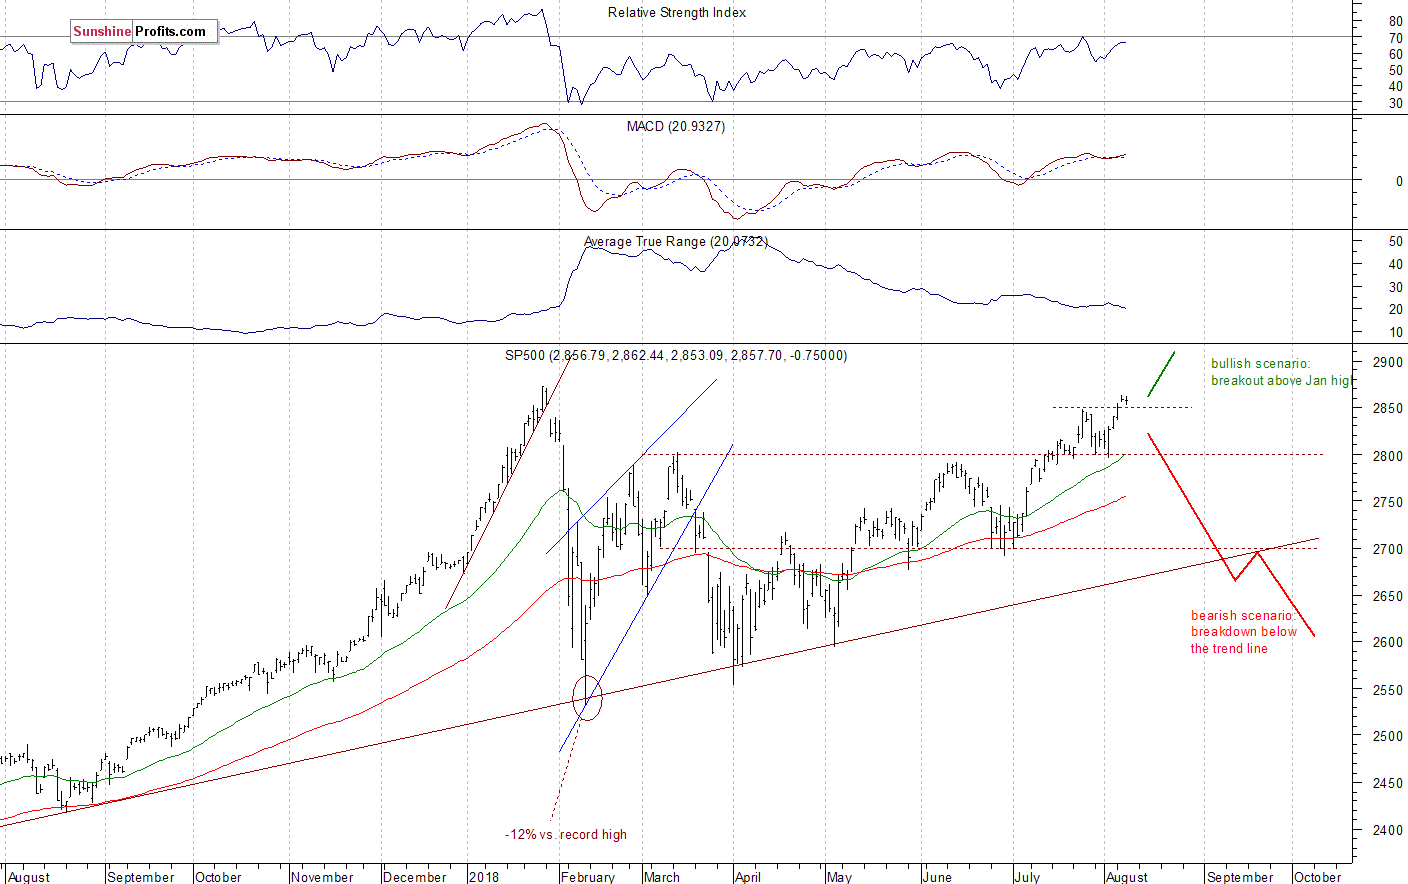
More Uncertainty As Stocks Got Closer To January Record High
The U.S. stock market indexes were mixed between -0.2% and +0.1% on Wednesday, as investors hesitated following the recent advance. The S&P 500 index remains above the level of 2,850 and it currently trades just 0.5% below the January's 26th record high of 2,872.87. The Dow Jones Industrial Average lost 0.2% and the technology Nasdaq Composite gained 0.1% yesterday.
The nearest important level of support of the S&P 500 index remains at around 2,850, marked by the recent level of resistance. The next level of support is at 2,825-2,835, marked by the recent local lows. The support level is also at around 2,800. On the other hand, the nearest important level of resistance is at 2,870-2,875, marked by the mentioned January's all-time high. Potential level of resistance is also at 2,900.
The broad stock market got even closer to its January's record high, as investors' sentiment improved following quarterly corporate earnings, economic data releases. The S&P 500 index broke above the level of 2,850 on Tuesday following last Thursday's bounce off 2,800 mark. But will it continue higher? There are still two possible medium-term scenarios - bearish that will lead us towards the February low again, and the bullish one - breakout higher towards 3,000 mark. The latter one is getting more and more real. The S&P 500 index still seems to be "climbing a wall of worries" here:
(Click on image to enlarge)
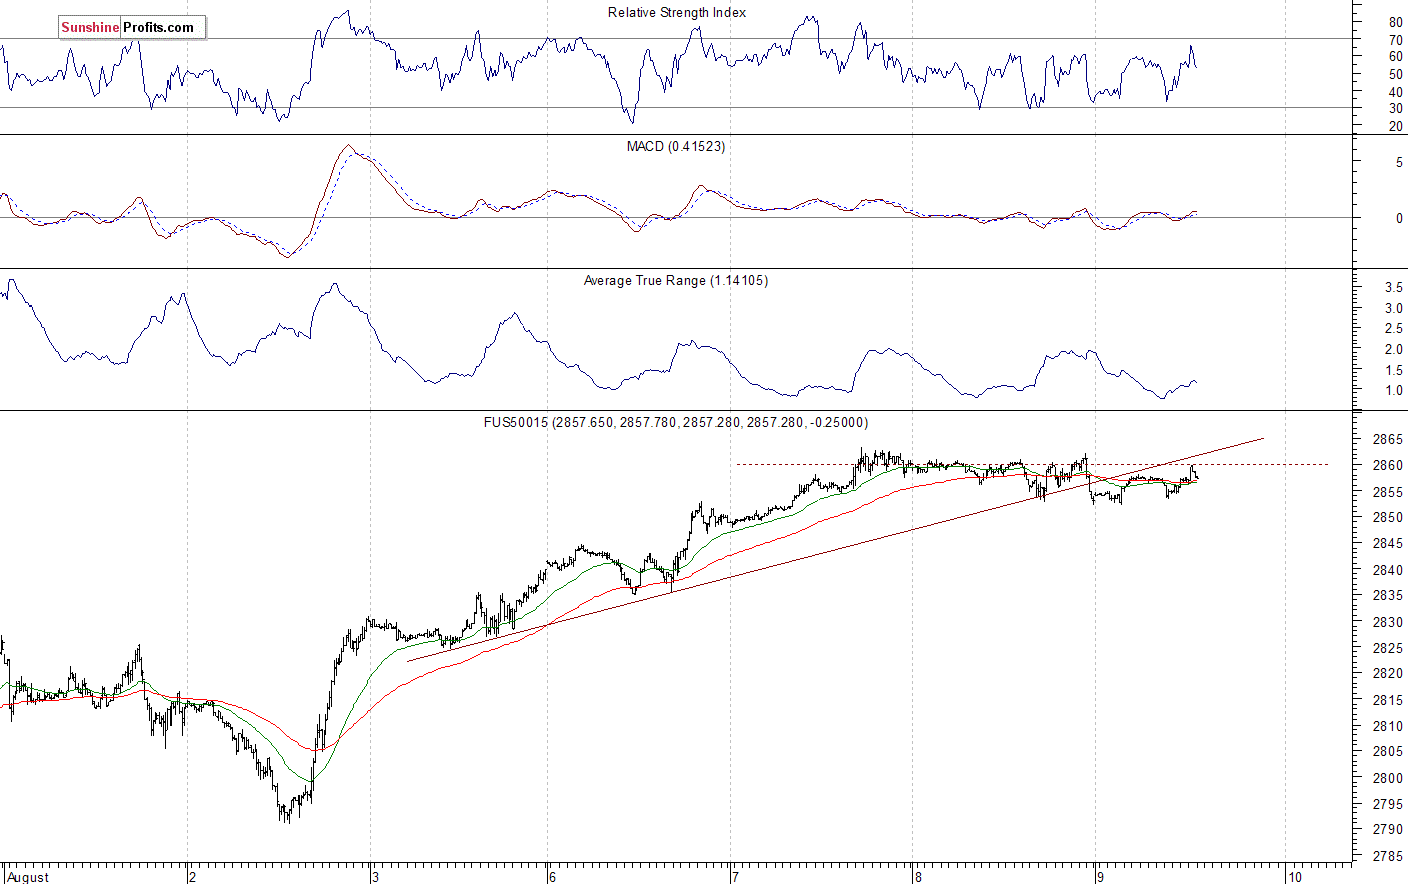
Short-term Consolidation, Topping Pattern or Just Pause?
Expectations before the opening of today's trading session are slightly positive, because the index futures contracts trade 0.1% higher vs. their yesterday's closing prices. The main European stock market indexes have been mixed so far. Investors will wait for some economic data announcements:Producer Price Index, Initial Claims at 8:30 a.m., Wholesale Inventories at 10:00 a.m. The broad stock market may extend its short-term consolidation today. There have been no confirmed negative signals so far. However, there are some short-term overbought conditions and stocks trade slightly below the medium-term resistance level.
The S&P 500 futures contract trades within an intraday uptrend, as it retraces its overnight decline. The nearest important level of resistance is at around 2,860-2,865, marked by the recent local highs. On the other hand, support level is at 2,850-2,855, marked by some short-term local lows. The support level is also at 2,845-2,850. The futures contract is now below its short-term upward trend line, as we can see on the 15-minute chart:
(Click on image to enlarge)
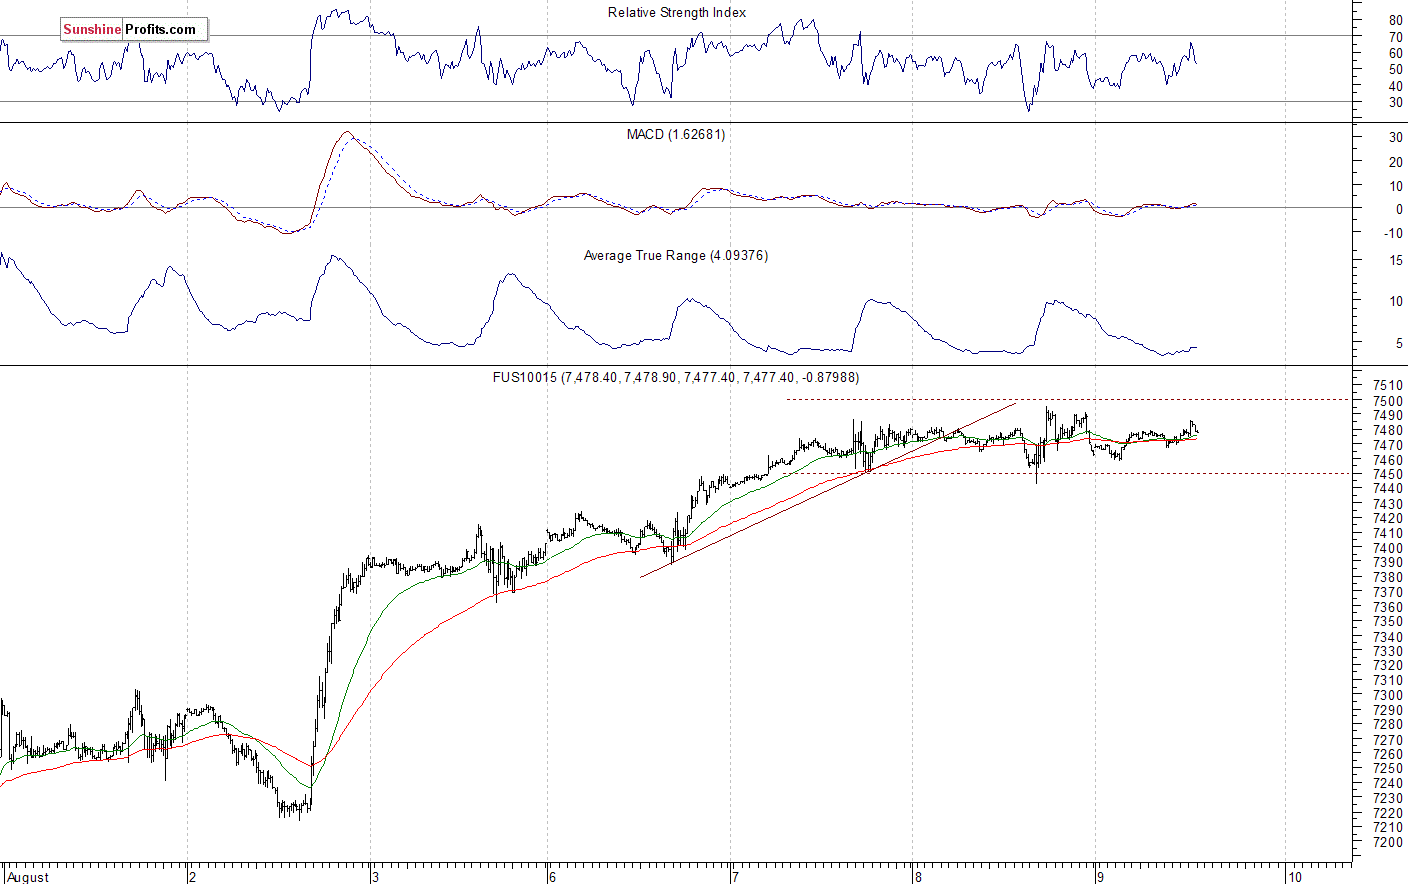
Nasdaq Remains Slightly Below 7,500 Mark
The technology Nasdaq 100 futures contract follows a similar path, as it gets back to its recent local highs this morning. However, the big cap tech stocks gauge is relatively weaker than the broad stock market, as it remains below the late July record high of around 7,530. The nearest important level of resistance is at 7,480-7,500. On the other hand, support level is at 7,400-7,450. The Nasdaq futures contract trades within a short-term consolidation slightly below the level of 7,500, as the 15-minute chart shows:
(Click on image to enlarge)
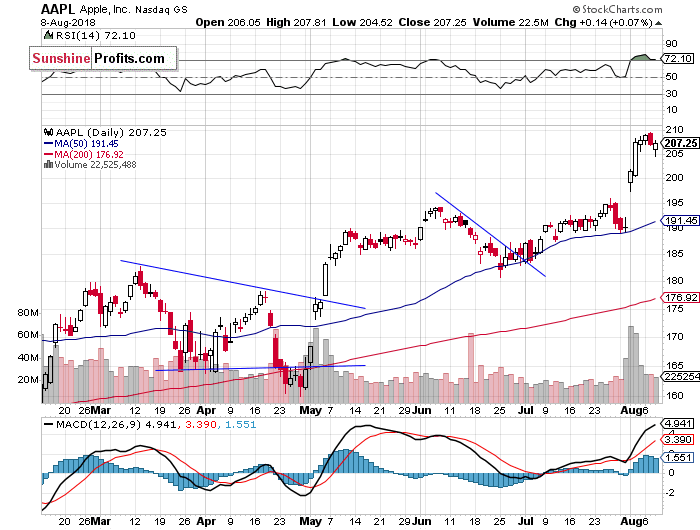
Amazon at New Record High, Apple Pauses
Let's take a look at Apple, Inc. stock (AAPL) daily chart (chart courtesy of http://stockcharts.com). The stock reached yet another new record high on Tuesday at the level of $209.50, but we saw some profit-taking action later in the day. Then it retraced some of its recent rally on Wednesday. Will it continue higher despite some clear short-term technical overbought conditions? There have been no confirmed negative signals so far. The nearest important level of support is now at $190-200, marked by the previous resistance level:
(Click on image to enlarge)
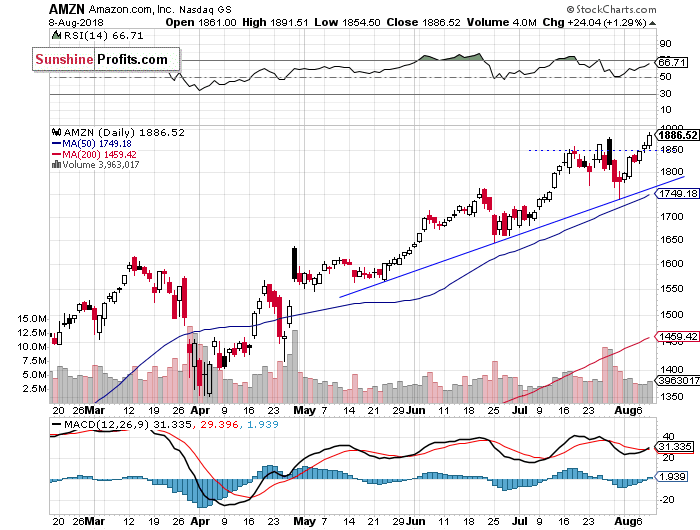
Now let's take a look at Amazon.com, Inc. stock (AMZN) daily chart. It reached new record high yesterday at the level of $1,891.51, following the recent breakout above the price of $1,850. The nearest important level of resistance is now at around $1,900. On the other hand, support level is at 1,850. The stock continues to trade above its medium-term upward trend line, as we can see on the daily chart:
(Click on image to enlarge)
Dow Jones Slightly Above 25,500
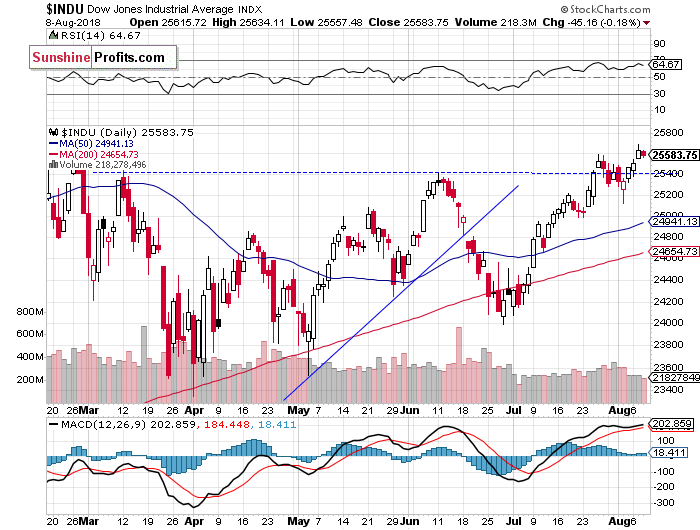
The Dow Jones Industrial Average extended its short-term uptrend recently, as it broke above the local high of around 25,600. The nearest important level of resistance is now at around 25,800, marked by the late February local high. The blue-chip stocks' gauge is still relatively weaker than the broad stock market, as it trades well below the late January's record high of 26,616.71. There have been no confirmed negative signals so far:
(Click on image to enlarge)
The S&P 500 index fluctuated yesterday following Tuesday's move up. The broad stock market got closer to its late January's record high recently. Will the uptrend continue? There have been no confirmed negative signals so far, but we can see some short-term technical overbought conditions.
Concluding, the broad stock market will likely open virtually flat or slightly higher today. We may see some more short-term profit-taking action. Investors will react to the mentioned economic data releases today.
Disclosure: None.


