
More Correction Likely
Market Overview
“There is also a fairly reliable short-term cycle which is scheduled to make its low on Tuesday/Wednesday.”
In retrospect, there were probably two short-term cycles bottoming about a week apart which were responsible for the decline from 2193. This was followed by a period of consolidation until the Fed provided the trigger for the next rally, after the second cycle had made its low. The first phase of the base which was created was reached on Thursday, followed by a correction on Friday which could have ended when it reached the top of a good support level at the close. However, although the daily indicators are in an uptrend, the hourly indicators are still declining, so we could see a little more on the downside before we turn up again.
Because of the base structure, it is not clear how much higher we can go, but another five to fifteen points higher than Thursday’s high are possible before more important cycles turn us back down and allow the correction to continue for another few weeks.
Analysis (This chart and others below, are courtesy of QCharts.com.)
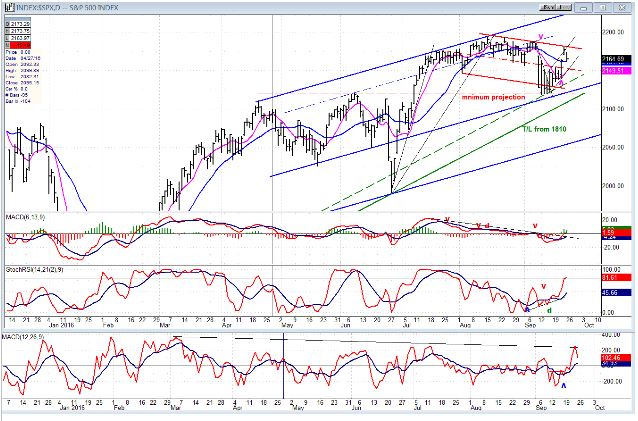
Daily chart
The longer-term trend, as shown by the daily chart, is clearly up, but there is a lot of deceleration taking place suggesting that a larger cycle is topping and causing the price structure to slowly roll over -- possibly all the way into mid-November. The correction which had begun was interrupted by the bottoming of some short-term cycles which are pushing prices up temporarily.
Since the high of 2193, the SPX has corrected in a gently sloping red channel which is also clearly visible on the DJIA. Both found resistance at the top of that channel and were pushed back on Friday, but there could be enough short-term momentum left to take the indexes slightly outside of the channel line before the current rally comes to an end. This is what base count is suggesting. Afterwards, the correction which started in mid-August should continue until it makes a final low in the vicinity of the blue parallel which is drawn from the bottom of the Brexit decline.
Two of the indicators started to resist the downtrend ahead of the Fed meeting and moved up sharply after it reported no change in interest rate. They began to correct with Friday’s decline, but are still in an uptrend and could have one more push up. The MACD is not looking as bullish. It made a new low while the others were stabilizing and does not display their kind of upside momentum. This is a sign that even if it does make a slightly new high, SPX should roll over shortly afterwards.
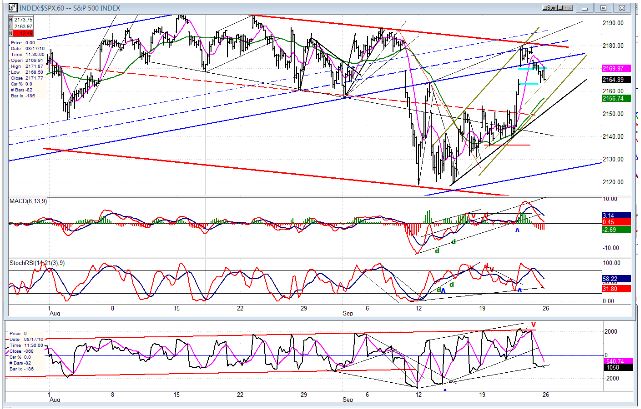
Hourly chart
The rally ran into strong resistance at the same time as SPX filled a phase count, and that was enough to create a temporary halt. The correction will not have retraced .382 of the uptrend from 2120 until it reaches 2156 so, especially with the hourly oscillators still in a downtrend, we may continue to decline on Monday until we reach 2156-2160. The uptrend is framed by the green trend lines, but there is also a lower black trend line which connects the two lows and it will not be until that one is broken that we can expect the correction to continue.
On Friday, the opening gap from the day before was almost filled and, since we closed practically on the low of the day, we should fill it completely on Monday before turning up. The fact that the oscillators are still in a downtrend also suggests that there is a little more to go in the retracement before we start on the next up-wave. We should find out during the early part of the week if we are ready to go higher (past the red channel line) before rolling over for a deeper correction.
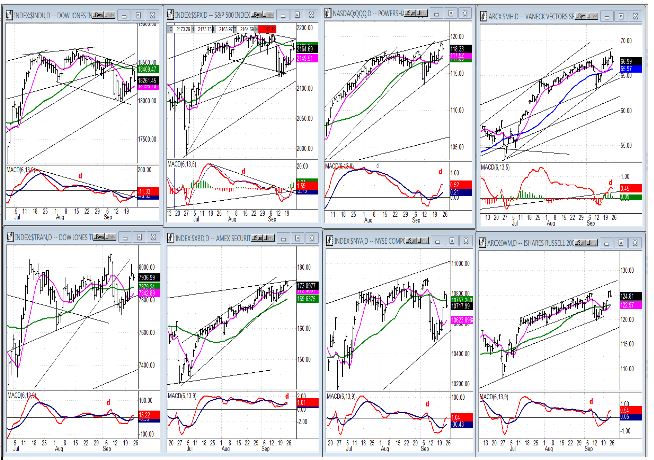
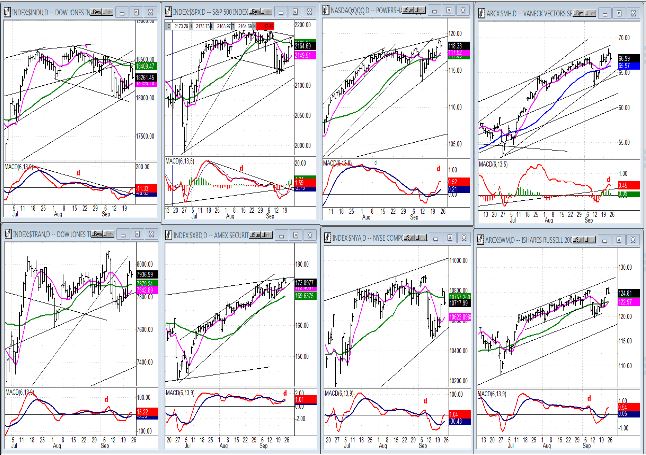
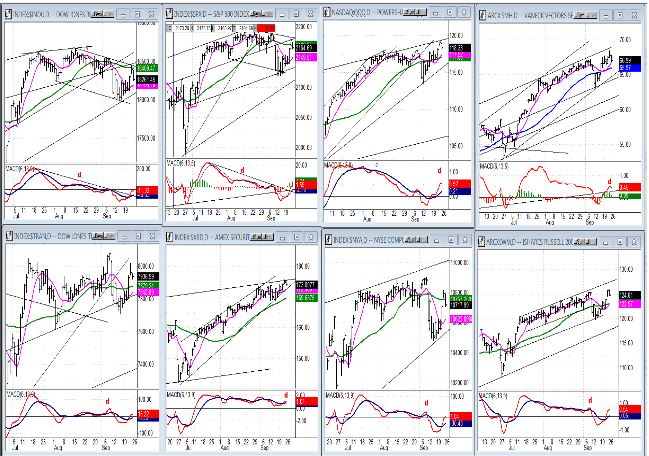
Some leading & confirming indexes (Daily charts)
Four of the five indices we follow made new highs on this move. The two major indexes did not, with DJIA beginning to lose ground to SPX. The mixed picture continues, but we should note that negative divergence is showing in all indicators, so it seems to fit our view that we are in the process of making a top of sorts and that we are not ready to move the SPX to its longer-term projection of 2240 just yet.
UUP (dollar ETF)
UUP is neutral, and could go either way. Last week’s attempt at breaking out of its consolidation channel failed to follow-through.
GDX (Gold Miners ETF)
GDX is still in an intermediate correction after topping in August. It held support just above its former short-term low and rallied along with the market, but has already lost more than half of its gains. It’s probably only a matter of time before it continues its corrective downtrend.
Note: GDX is now updated for subscribers several times throughout the day along with SPX, on Marketurningpoints.com.
USO (U.S. Oil Fund)
Last week was another failed attempt at breaking out of its long-term downtrend. Looks like more base building is ahead.
Summary
SPX quickly put a halt to its correction from 2193 and built a base while it waited for the next FOMC meeting. After the decision was announced, it broke out of its base and met its first phase target which took it back to the top of its corrective channel. There are higher projections which could (should) be reached before the current rally peaks, and the correction resumes for another month or two.
Disclosure: Market Turning Points is an uncommonly dependable, reasonably priced service providing intra-day market updates, a daily Market Summary, and ...
more


Thanks for sharing