
Modeling Risk With Bootstrapping Techniques In R
Limited data is the financial modeler’s biggest challenge. Making assumptions about risk is tough enough under the best of circumstances. All too often it’s even tougher when the historical record is thin. There are several ways to manage this challenge, including bootstrapping, aka resampling the available data to create historical records that might have occurred. Nothing’s perfect, of course, but bootstrapping can be a powerful tool for stress testing portfolios and developing robust assumptions about risk.
As a simple example, let’s go through a basic procedure for the analyzing the S&P 500’s risk premium (nominal return less the risk-free rate). Imagine that we’re in the dark about its exposure to market beta. We’re not, of course – it’s obvious that the S&P’s market beta will generally fluctuate around 1.0. The index, after all, is widely considered as the market for US equity risk. But since we know the outcome in advance, reviewing the logic to develop the answer quantitatively provides some insight for applying the procedure to questions where the answer isn’t so obvious – modeling risk for a custom portfolio with various asset classes, for instance. Keep in mind that we’re hardly restricted to beta for bootstrapping analysis, but in the interest of brevity let’s stick with this metric in our toy example.
One way to begin is to run a factor analysis on the asset or portfolio in question, in this case the S&P 500. Let’s use the Fama-French 3-factor model plus momentum, which breaks down equity risk into broad market, small-company, value and momentum factors. The data can be found at Professor Ken French’s web site. Crunching the numbers (using R) clearly shows that the factor loadings for the S&P 500 (based on monthly data from 1951 through last month) are heavily influenced by market beta. As you can see in the regression output below, the market coefficient is roughly 0.99, which is basically telling us that the S&P 500 is overwhelmingly dominated by market beta for explaining risk and return.
|
1 2 3 4 5 6 7 8 9 10 11 12 13 |
|
If the S&P was truly our quarry, we could stop right here, confident in the knowledge that the market factor is close to the first and last word on risk analysis for the S&P. But let’s forge ahead to illustrate how we might develop a higher level of conviction for an asset, fund, or portfolio that’s less transparent.
This is where bootstrapping comes in handy. The issue is that we only have one historical record to assess. By the standards of finance, the S&P has a relatively long history, but it’s not unusual these days to design portfolios with a broad range of assets, for which price histories are sometimes limited – think junk bonds or emerging market equities, for instance.
One way around this limitation is to create alternative datasets via bootstrapping as a tool for evaluating how much variability to expect for risk, in this case beta. To generate the alternative histories that might have been, we can resample (with replacement) the actual historical record. Let’s do so for the S&P 500’s beta (using the boot package). If you’re curious about the code, see Chapter 12 in the book R in Action: Data Analysis and Graphics with R for a general outline on the bootstrapping procedure.
Meantime, a quick recap of the S&P’s actual beta through time, based on a 36-month rolling window.
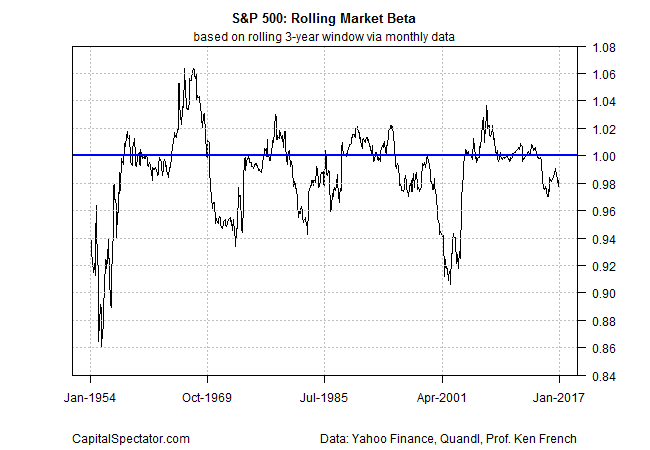
As you can see, the beta has remained in a fairly tight range around 1.0. That’s a sign that the market factor is relatively stable and persistent. Using the historical record as a guide, we might project that the S&P’s beta will fluctuate between 0.92 and 1.06. Note, however, that beta dipped to around 0.86 in the early 1950s. Is that a sign that the subsequent history isn’t fully representative of what could happen?
For some insight, let’s bootstrap the S&P’s beta – creating 10,000 alternative histories and summarize the output in a density plot, which shows the distribution of the bootstrap results (blue line). The vertical red line is the actual beta (0.993) for the sample period.
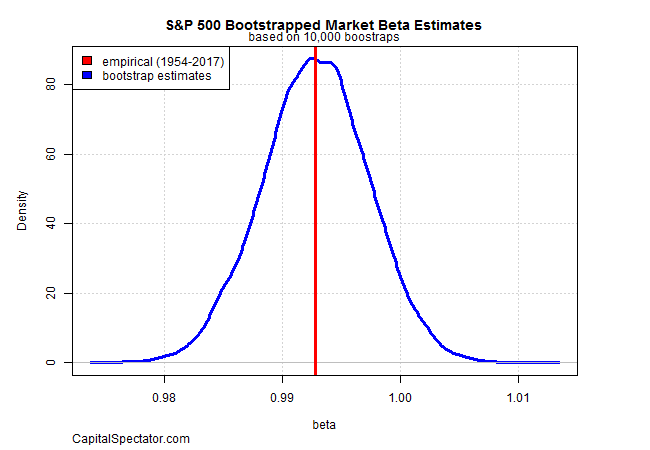
The results suggest that the S&P’s beta is likely to remain in a range of about 0.98 to 1.01. That’s a rough match for the historical record. None of this is terribly surprising, given what we know about the index.
The real value for this type of analysis is applying bootstrap analysis to assets, funds, and portfolio strategies with limited real-world histories. Although we used beta in this illustration, the sky’s the limit for alternative metrics and analytics via the bootstrapping procedure. Indeed, if we we’re serious about modeling risk, we’d run the methodology outlined above across various dimensions of risk. The amount of effort we should put into this task should be guided by a simple rule: The higher level of customization for a given investment strategy, the greater the uncertainty about what could happen and therefore the greater the need for bootstrapping.
Risk guru Peter Bernstein once defined risk as the possibility that “more things can happen than will happen.” Bootstrapping is one of several tools for quantifying Bernstein’s observation in a bid to develop a bit more insight into what could be waiting around the next bend.
Disclosure: None.


