
Mid Cap Best & Worst Report - November 18, 2015
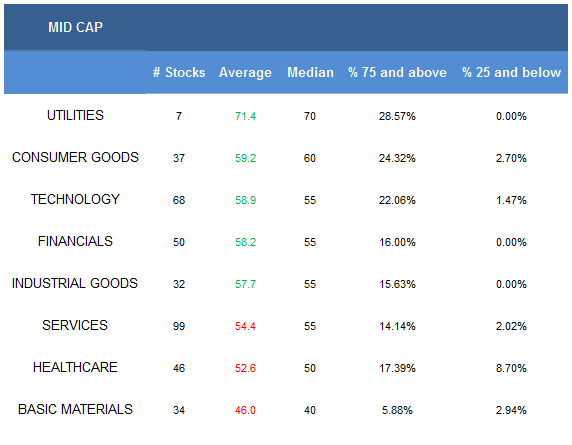
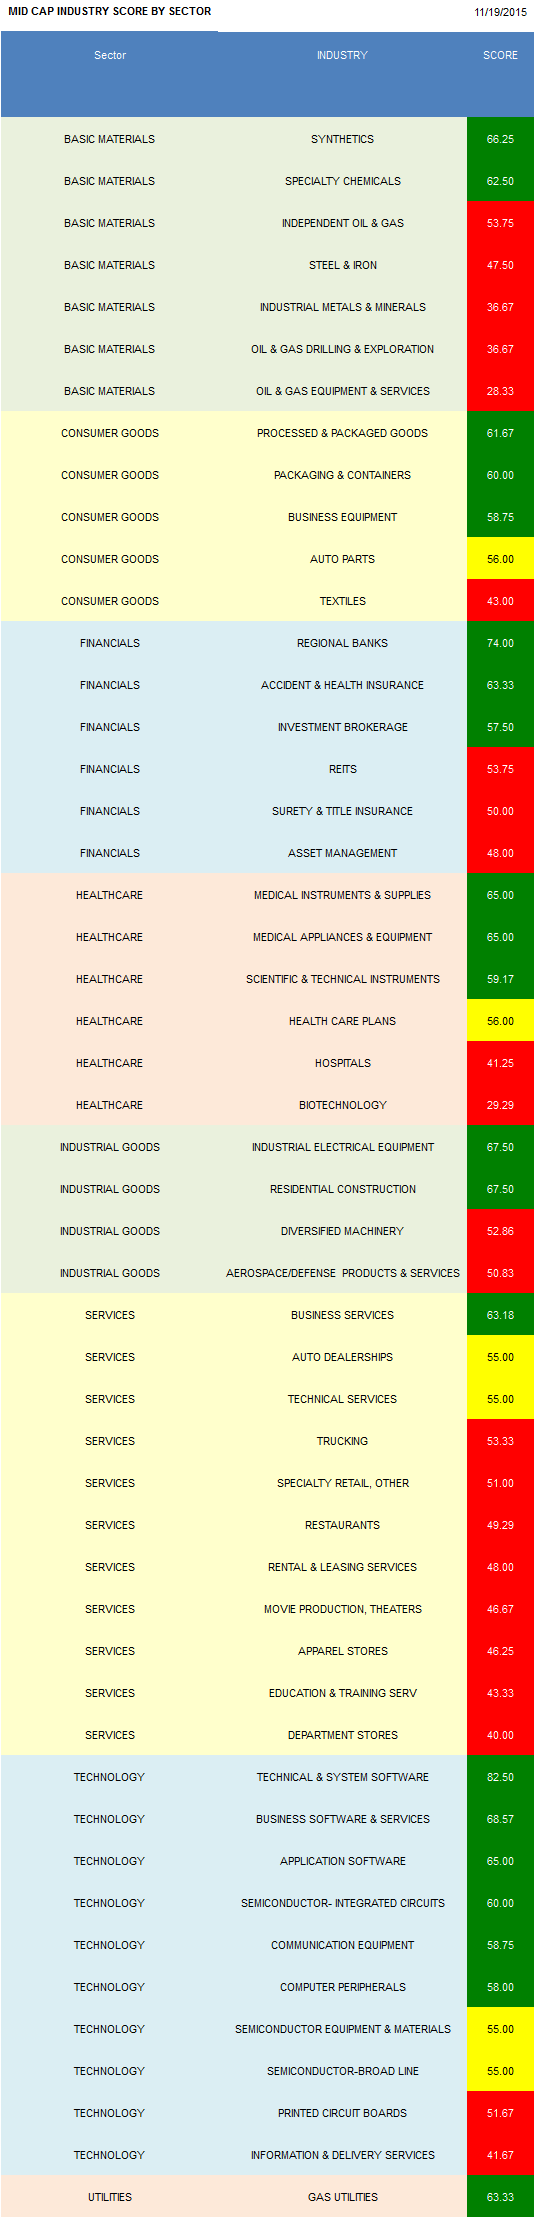
- Utilities and consumer goods are the top mid cap sectors.
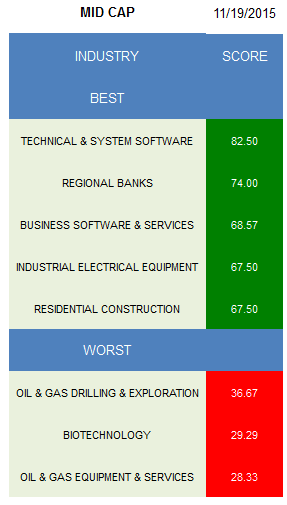
- Technical & system software is the best industry.
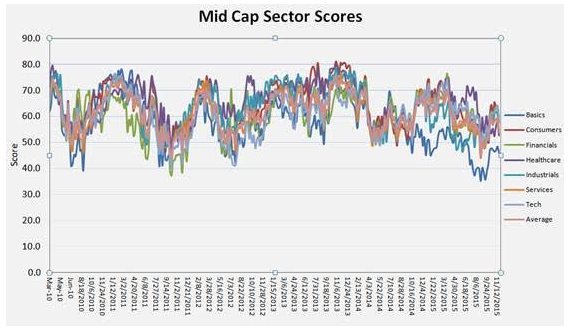
The average mid cap score is 55.77 and that's below the four week moving average score of 58.58. The average mid cap stock in our universe is trading -24.23% below its 52 week high, -6.49% below its 200 dma, has 6.76 days to cover held short, and is expected to grow EPS by 15.6% next year.
Utilities, consumer goods, technology, financials, and industrials score above average. Services, healthcare, and basic materials score below average.
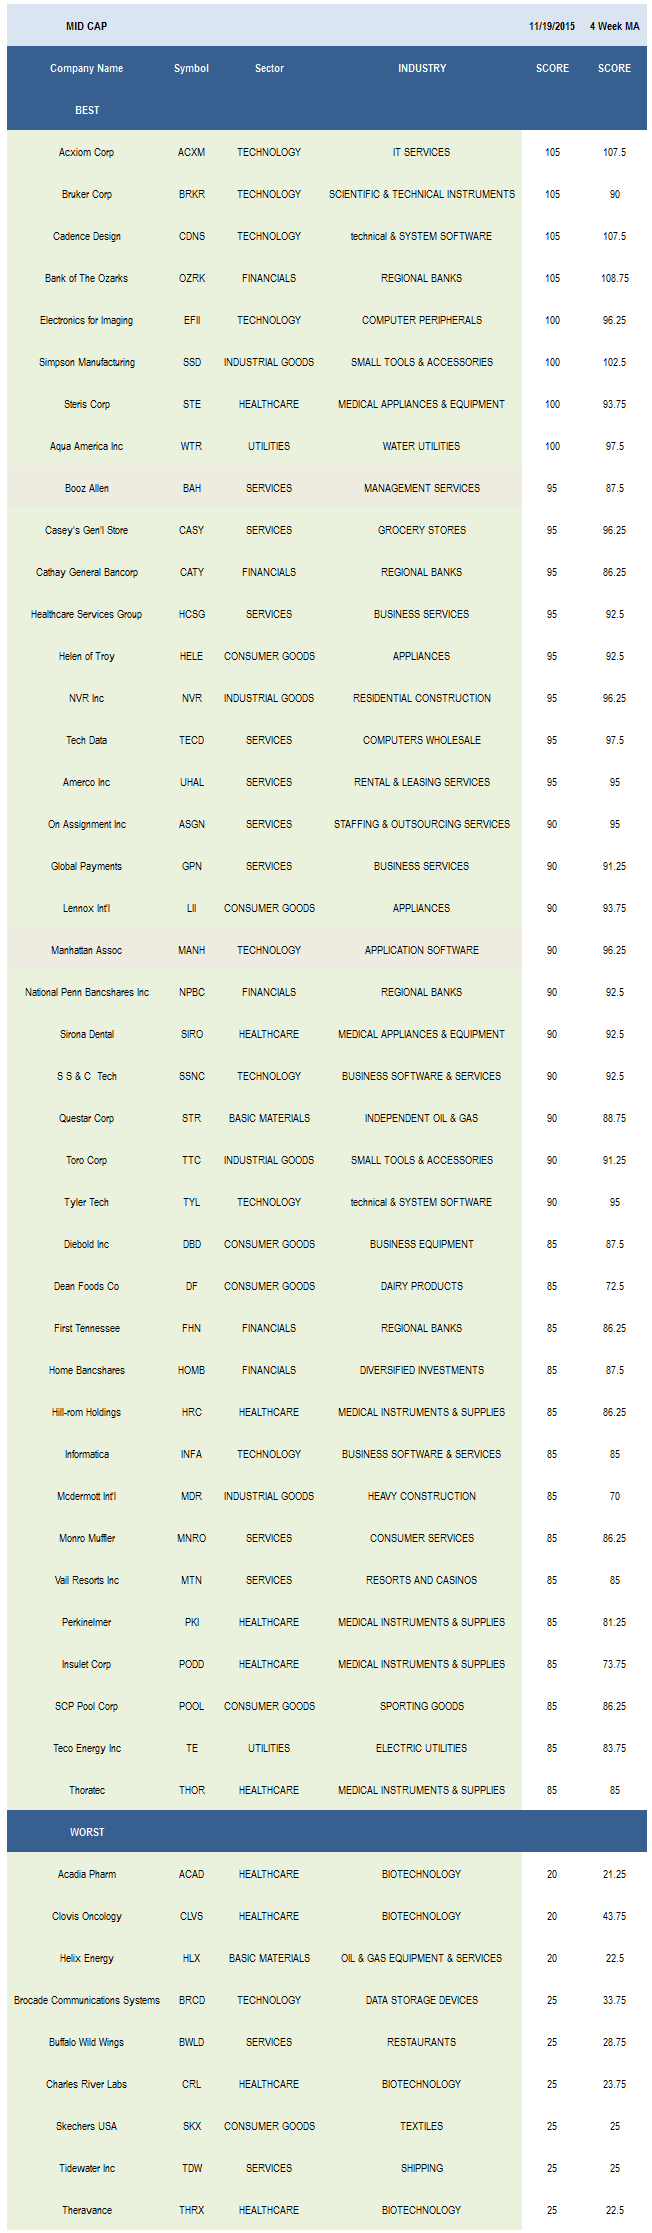
The strongest mid cap industries are technical & system software (CDNS, TYL, MENT) and regional banks (OZRK, CATY, NPBC, FHN, FFIN, ASB). Business software (SSNC, INFA, WBMD, PEGA), industrial electrical (AOS, RBC) and residential construction (NVR) can also be overweight.
Only synthetics (CMP, POL, MTX) and specialty chemicals (CBT) score above average in basics. Regional banks, accident & health (AIZ, AFL), and investment brokers (MKTX) score best in financials. Medical instruments (THOR, PODD, PKI, HRC, WST), medical appliances (STE, SIRO, MDRX, GMED), and scientific & technical instruments (BRKR) are strongest in healthcare. In industrials, concentrate on industrial electrical and residential construction. Business services (HCSG, GPN, RBA, HPY, CMPR) are best in services. Technical & system software, business software, and applications software (MANH, LOCK) offer upside in technology. Gas utilities (PNY, NJR) can also be bought.
Disclosure: None.


