
Mid Cap Best & Worst Report - May 11, 2016
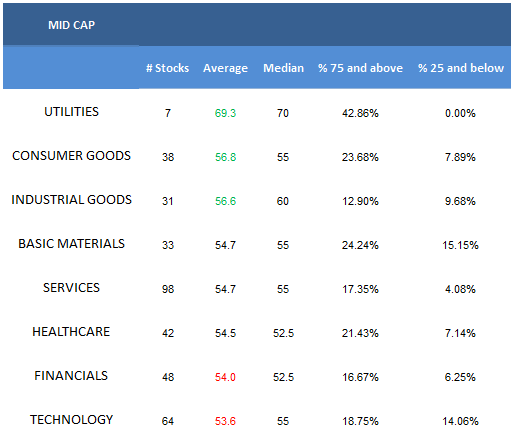
- The best mid cap sectors are utilities and consumer goods.
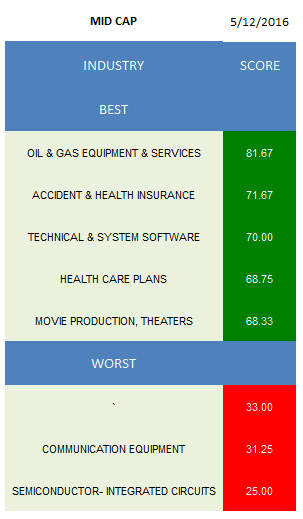
- The highest scoring mid cap industry is oil & gas equipment & services.
The average mid cap score is 55.09 and that's below the four week average mid cap score of 56.53. The average mid cap stock in our universe is trading -22.77% below its 52 week high, 1.65% above its 200 dma, has 6.96 days to cover held short, and is expected to grow its EPS by 16.33% in the next year.
Utilities, consumer, and industrials score best. Basics, services, and healthcare score in line. Financials and technology score below average. The ranking is shifting defensive.
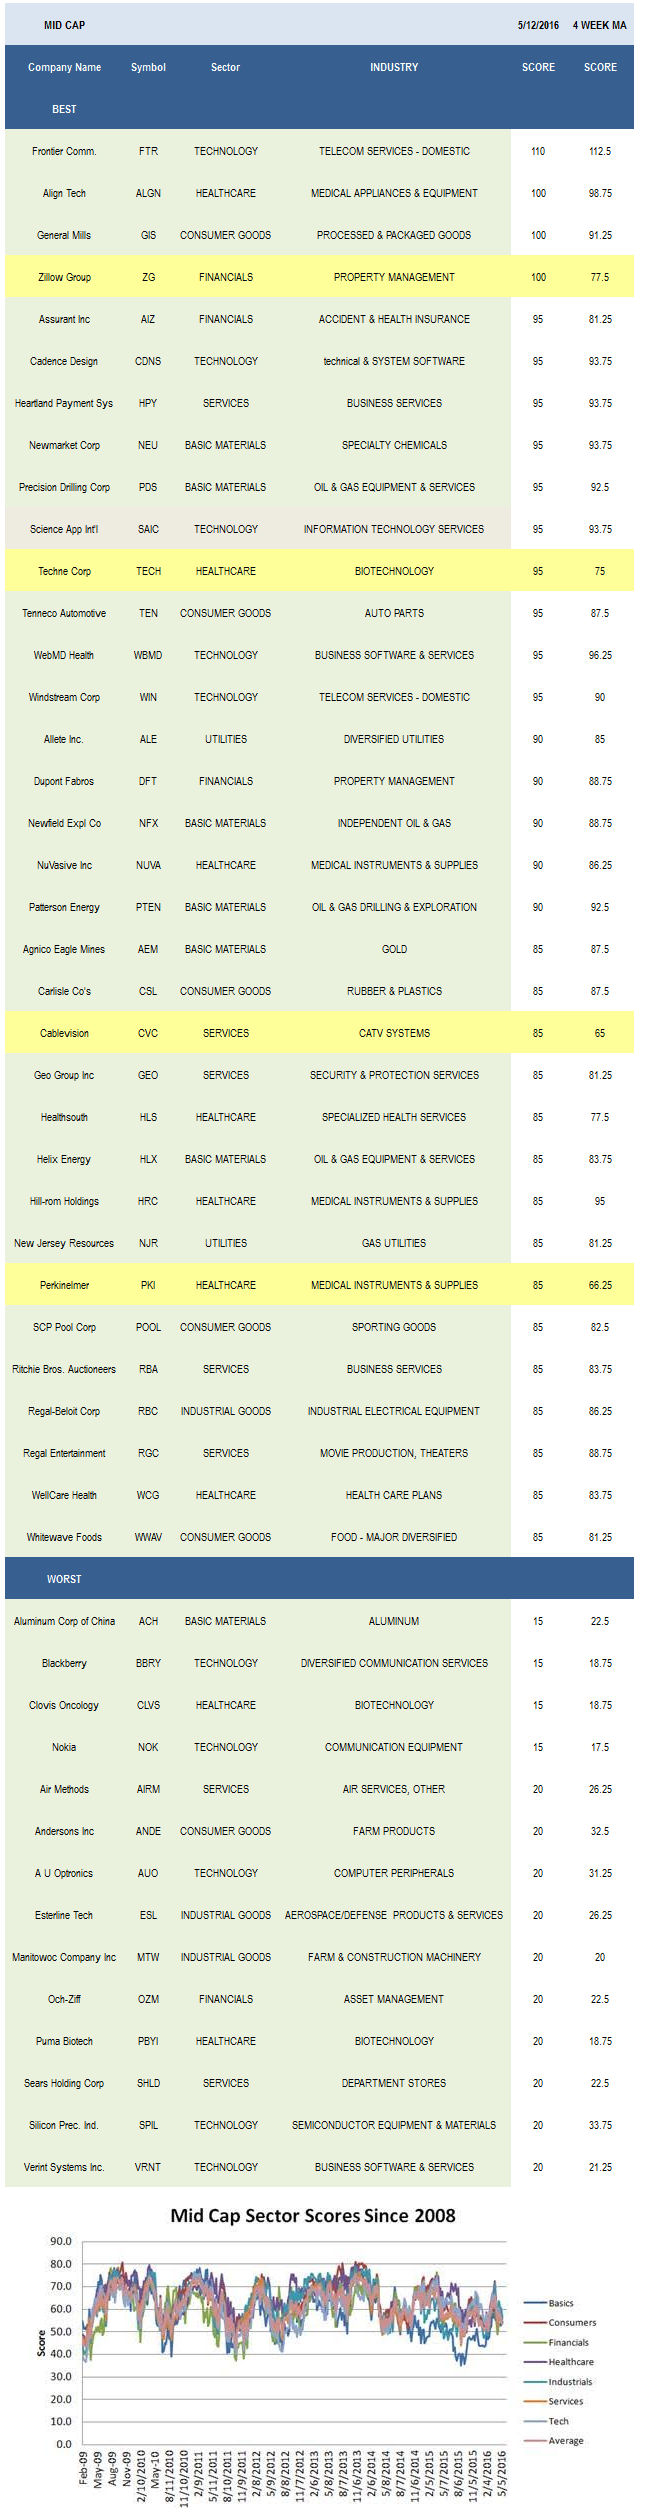
Oil & gas equipment & services (PDS, HLX) is the top mid cap industry. Accident & health insurance (AIZ), technical & system software (CDNS, MENT), healthcare plans (WCG), and movies (RGC, DWA) score best in mid cap.
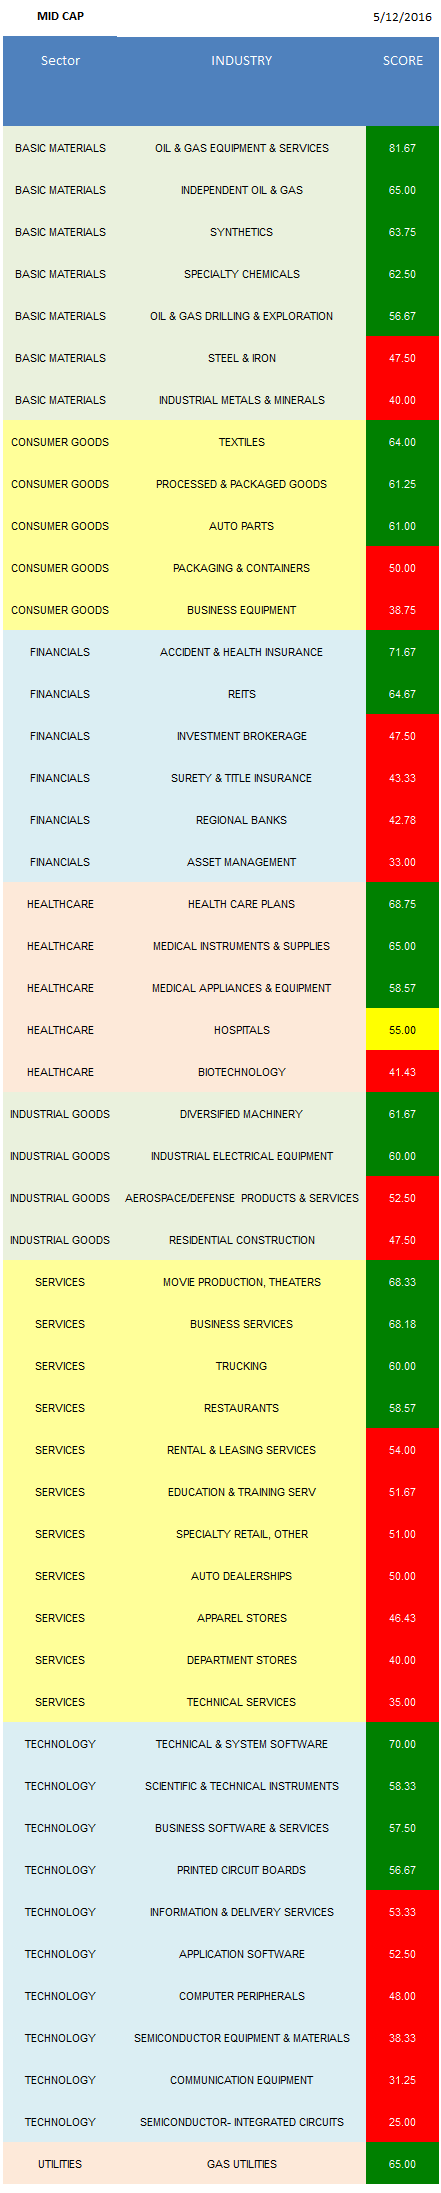
In basics, concentrate on oil & gas equipment & services, independent oil & gas (NFX), and synthetics (POL). The top consumer groups include textiles (COLM, CRI), processed & packaged goods (GIS), and auto parts (TEN, FDML). In financials, focus on accident & health insurance and REITS (LXP, REG, CLI). Healthcare plans, medical instruments (NUVA, PKI, HRC, TFX), and medical appliances (ALGN, MASI) are best in healthcare. Diversified machinery (ATU, BGG) and industrial electrical (RBC) score high in industrials. Movies, business services (HPY, RBA, GPN), and trucking (KNX, ODFL) are top scoring in services. Technical & system software, scientific & technical instruments (COHR, CGNX), and business software (WBMD, PEGA) score best in technology. Gas utilities (NJR) can also be owned.
Disclosure: None.


