
Mid Cap Best & Worst Report - January 20, 2016
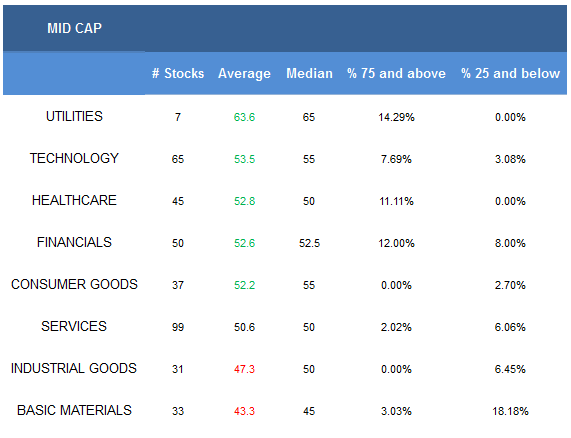
- The top mid cap sectors are utilities and technology.
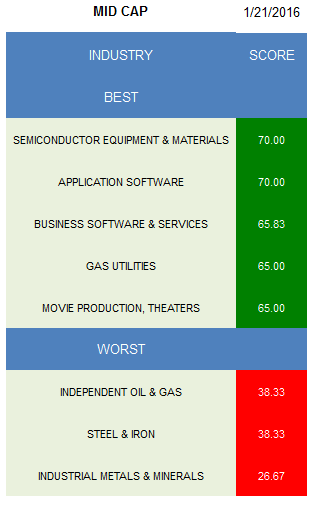
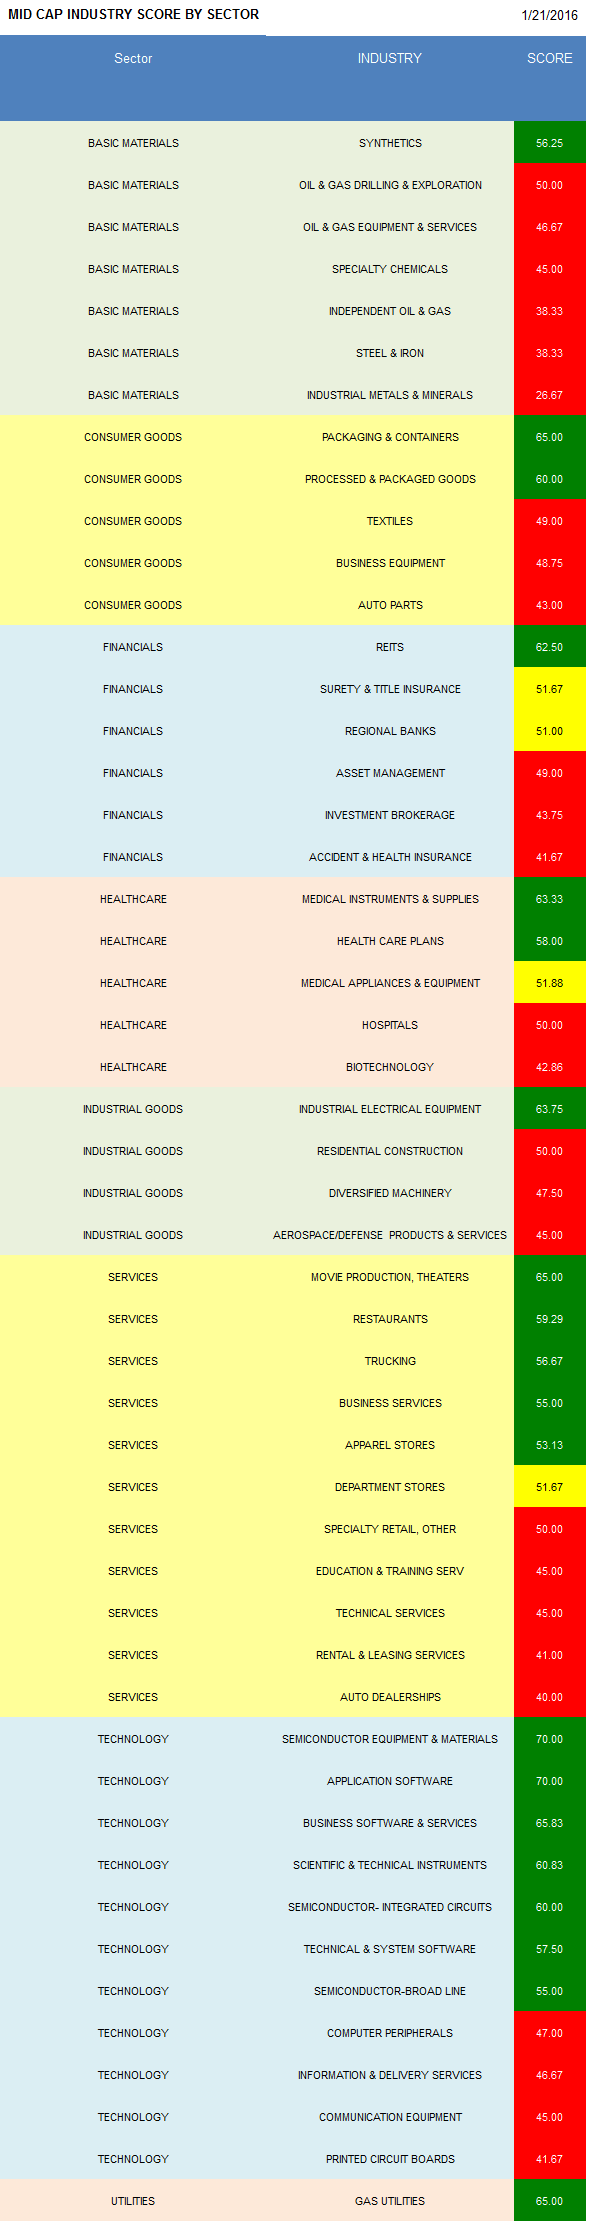
- Semi equipment is the best scoring industry.
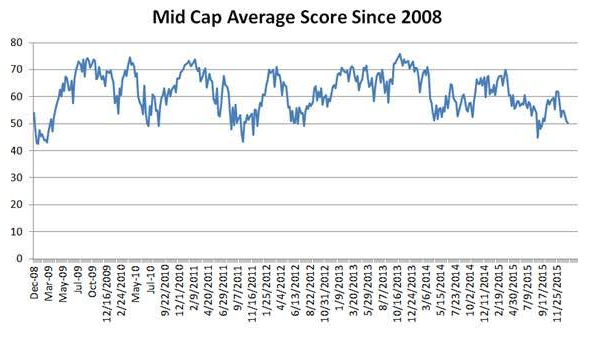
The average mid cap score is 51.10 and that's below the four week average score of 53.99. The average mid cap stock in our universe is trading -32.63% below its 52 week high, -14.96% below its 200 dma, has 6.9 days to cover held short, and is expected to grow EPS by 13.5% in the coming year.
Utilities, technology, healthcare, financials, and consumer goods score above average. Services score in line with the average score. Industrial goods and basics score below average.
The following chart shows historical mid cap scores back to 2008. Typically, an average score below 50 coincides with an actionable buy point.
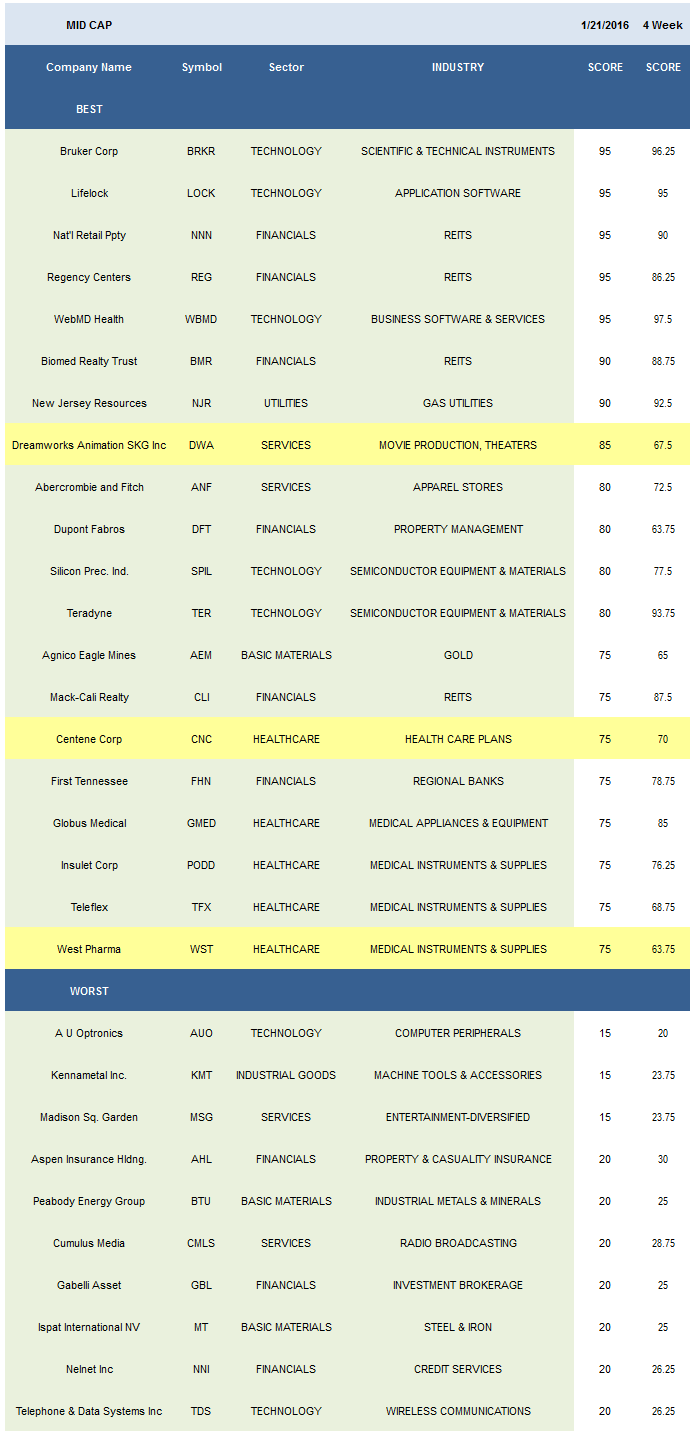
Three technology industries are the best scoring industries in mid cap this week: semi equipment & materials (TER, SPIL), application software (LOCK, NUAN), and business software (WBMD, ROVI). Gas utilities (NJR) and movie theaters (DWA) also score high.
Only synthetics (MTX, CMP) score above average in basics. Packaging & containers (TUP, MINI) and processed & packaged goods (GIS) are strongest in consumer goods. REITs (REG, NNN, BMR, CLI) are the only high scoring financials industry. Medical instruments (WST, TFX, PODD) and healthcare plans (CNC, HNT) can be bought in healthcare. The best industrials basket is industrial electrical (BDC). Movie theaters, restaurants (WEN, TXRH, CBRL), and truckers (ODFL, KNX) are high scoring in services. Semi equipment, application software, and business software offer upside in technology. Gas utilities can also be bought.
Disclosure: None.


