
Michael Kors Takes Lead On S&P 500 Stock List
High Fashion
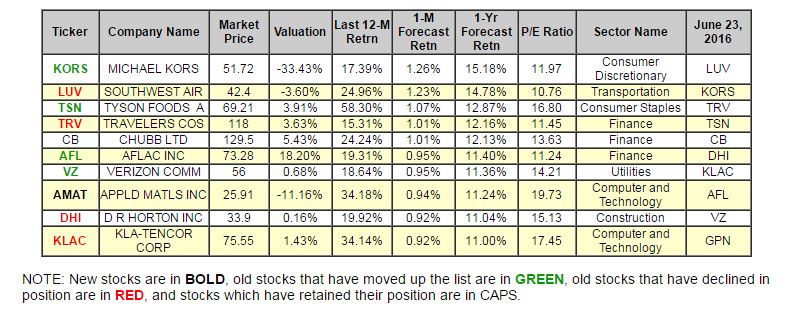
In our last update, Michael Kors (KORS) debuted in the number two position and has now climbed into the first spot according to our models. Southwest Airlines (LUV) and Traveler's (TRV) declined one spot each as Tyson Foods (TSN) is now in third place. Chubb Limited (CB) retains its spot in the middle of our top-ten list. AFLAC (AFL) and Verizon (VZ) also managed to moved up a few spaces--with DR Horton (DHI) and KLA-Tencor (KLAC) declining and just managing to hang on--barely. Applied Materials (AMAT) returns to our top ten as Global Payments (GPN) has fallen off the charts. That last move is our only overall change to the list-- just one new stock this time.
(Click on image to enlarge)
Below is today's data on our SP500 leader, Michael Kors (KORS)
Michael Kors is a global accessories, footwear and apparel company. They offer two primary collections: the Michael Kors luxury collection and the MICHAEL Michael Kors accessible luxury collection. They also offer select footwear and outerwear through their KORS Michael Kors accessible luxury collection. They operate their business in three segments-retail, wholesale and licensing-and have a global distribution network focused on company-operated retail stores, leading department stores, specialty stores and select licensing partners.
Recommendation: We continues with a STRONG BUY recommendation on MICHAEL KORS for 2016-07-13. Based on the information we have gathered and our resulting research, we feel that MICHAEL KORS has the probability to OUTPERFORM average market performance for the next year. The company exhibits ATTRACTIVE Company Size and P/E Ratio.

|
ValuEngine Forecast |
||
|
Target |
Expected |
|
|---|---|---|
|
1-Month |
52.37 | 1.26% |
|
3-Month |
52.25 | 1.03% |
|
6-Month |
51.86 | 0.27% |
|
1-Year |
59.57 | 15.18% |
|
2-Year |
45.79 | -11.46% |
|
3-Year |
29.89 | -42.20% |
|
Valuation & Rankings |
|||
|
Valuation |
33.43% undervalued |
Valuation Rank |
|
|
1-M Forecast Return |
1.26% |
1-M Forecast Return Rank |
|
|
12-M Return |
17.39% |
Momentum Rank |
|
|
Sharpe Ratio |
0.34 |
Sharpe Ratio Rank |
|
|
5-Y Avg Annual Return |
13.26% |
5-Y Avg Annual Rtn Rank |
|
|
Volatility |
39.00% |
Volatility Rank |
|
|
Expected EPS Growth |
8.80% |
EPS Growth Rank |
|
|
Market Cap (billions) |
10.65 |
Size Rank |
|
|
Trailing P/E Ratio |
11.97 |
Trailing P/E Rank |
|
|
Forward P/E Ratio |
11.00 |
Forward P/E Ratio Rank |
|
|
PEG Ratio |
1.36 |
PEG Ratio Rank |
|
|
Price/Sales |
2.26 |
Price/Sales Rank |
|
|
Market/Book |
5.58 |
Market/Book Rank |
|
|
Beta |
0.82 |
Beta Rank |
|
|
Alpha |
0.15 |
Alpha Rank |
|
Market Overview
|
Summary of VE Stock Universe |
|
|
Stocks Undervalued |
56.65% |
|
Stocks Overvalued |
43.35% |
|
Stocks Undervalued by 20% |
24.75% |
|
Stocks Overvalued by 20% |
14.21% |
Sector Overview
|
Sector |
Change |
MTD |
YTD |
Valuation |
Last 12-MReturn |
P/E Ratio |
|
Basic Materials |
0.73% |
7.45% |
50.46% |
17.01% overvalued |
41.03% |
31.26 |
|
Consumer Staples |
0.03% |
2.26% |
10.40% |
6.97% overvalued |
5.31% |
24.44 |
|
Utilities |
0.23% |
3.07% |
14.41% |
6.13% overvalued |
9.10% |
23.57 |
|
Multi-Sector Conglomerates |
-0.04% |
1.73% |
5.97% |
4.49% overvalued |
-6.38% |
18.79 |
|
Industrial Products |
0.00% |
3.84% |
9.28% |
0.56% overvalued |
-2.45% |
22.36 |
|
Oils-Energy |
-1.04% |
0.95% |
16.97% |
0.15% undervalued |
-24.80% |
24.02 |
|
Business Services |
0.07% |
3.33% |
14.32% |
1.12% undervalued |
-7.66% |
23.51 |
|
Construction |
-0.33% |
3.70% |
25.15% |
1.95% undervalued |
0.93% |
21.97 |
|
Aerospace |
0.28% |
2.62% |
-2.48% |
3.11% undervalued |
-4.39% |
19.68 |
|
Finance |
0.01% |
2.43% |
3.80% |
3.76% undervalued |
-2.52% |
16.24 |
|
Computer and Technology |
-0.14% |
2.94% |
8.65% |
3.85% undervalued |
-3.50% |
29.49 |
|
Consumer Discretionary |
-0.31% |
3.84% |
6.50% |
4.18% undervalued |
-7.20% |
21.79 |
|
Retail-Wholesale |
-0.58% |
3.23% |
-0.44% |
9.94% undervalued |
-10.65% |
22.01 |
|
Transportation |
0.08% |
5.66% |
6.42% |
10.10% undervalued |
-24.86% |
14.08 |
|
Medical |
-0.58% |
4.22% |
0.22% |
11.23% undervalued |
-22.25% |
27.67 |
|
Auto-Tires-Trucks |
-0.44% |
3.07% |
-2.38% |
18.23% undervalued |
-12.80% |
12.36 |
Valuation Watch: Overvalued stocks now make up 43.35% of our stocks assigned a valuation and 14.21% of those equities are calculated to be overvalued by 20% or more. Five sectors are calculated to be overvalued.
Disclosure: None.
Disclaimer: ValuEngine.com is an independent research provider, producing buy/hold/sell recommendations, ...
more

