

Earlier this week, we updated our commentary on household income distribution to include the Census Bureau's release of the 2016 annual data. Our focus was on arithmetic mean (average) household incomes by quintile (and the top 5%) over the 50-year history of this data series. The analysis offered some fascinating insights into U.S. household incomes.
But the classification misses the implications of age for income. Households are by no means locked into the same quintile over time. Young educated households with professional skills and aspirations will typically move into the higher earning brackets during their financial life cycles. Households dependent on income from unskilled labor and non-professional service employment will not see the same financial progress over the years.
So let's review the household income data another way, this time focusing on the incomes by the age bracket. The data we're analyzing is the median (middle) household income the age brackets for the heads of household (see Table H.10 for all races).
Because this is a longitudinal analysis across nearly five decades, including the stagflation of the 1970s, we've used the Census Bureau's real (inflation-adjusted) series chained in 2016 dollars based on a research variant of the Consumer Price Index, the CPI-U-RS. In other words, the incomes in earlier years have been adjusted upward to the purchasing power of the most recent year in the series.
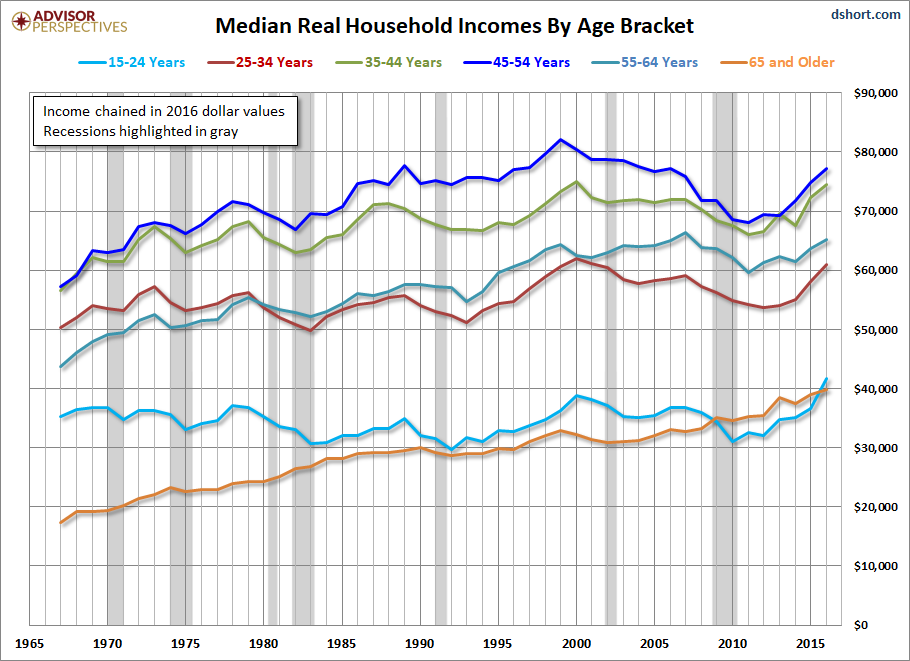
The first chart shows real household incomes of the six age brackets.
(Click on image to enlarge)
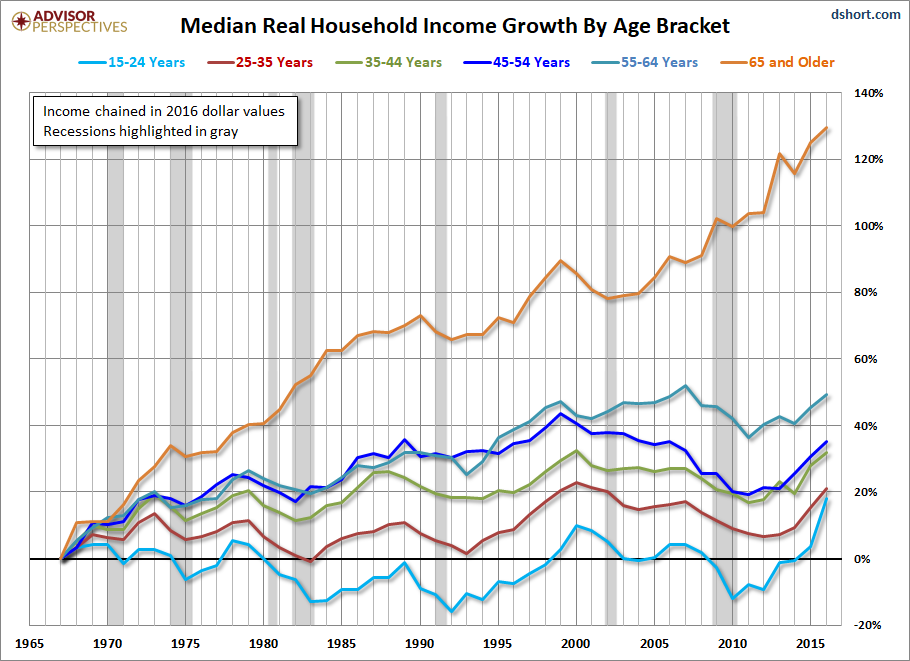
But more revealing is a comparison of the cumulative real growth of median incomes for the six age brackets.
(Click on image to enlarge)
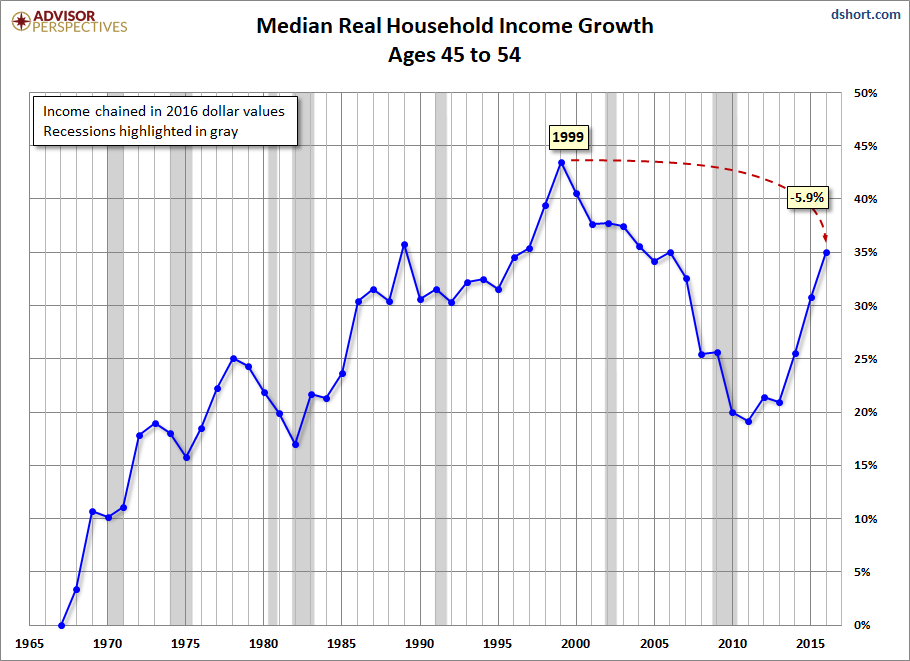
Let's focus on the plight of the peak earning age bracket, ages 45-54.
(Click on image to enlarge)
There are some immediate observations we can make about these charts:
- In the first chart, we see clearly that the 45-54 age bracket lays claim to the peak earning years for U.S. households.
- In the second chart, we see that the two older age brackets have cumulative growth superior to the peak earnings bracket. In fact, the 65 and older has been the best performer overall, and it has dramatically outperformed since the recession of 2001. We can no doubt attribute the outperformance to the contribution of Social Security to the income stream. It's a reliable source of income and carries a cost of living adjustment. Private and government pensions also contributed to the superior growth rate. Another key factor is the surprising growth in the labor force participation rate of this cohort, a topic we track in our monthly review of long-term trends in the workforce.
- In the third chart, we see in isolation the earnings decline for the households in the peak ten-year bracket. They have experienced a real decline of 5.9% in earnings since the 1999 peak, although the 2016 data point is well off the interim low set in 2011. The reasons, of course, can be widely varied — periods of unemployment, salary cuts, layoffs followed by a lower paying new job, a multiple-earner household in which one of the earners is a victim of unemployment, reduced employment, etc.
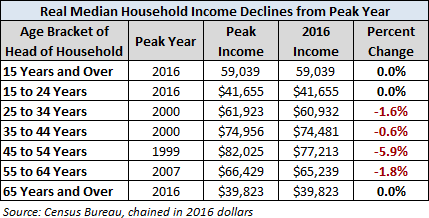
- The 21st century saw a remarkable decline in income for the first four age brackets with the onset of the Financial Crisis of 2008. However, as of 2016, incomes for the 15-24 and 65+ age groups reached new highs and only one age group, 45-54, saw its peak before 2000.
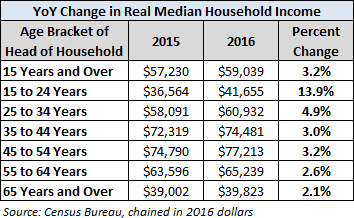
- The 15-24 cohort saw the largest increase in 2016, a 13.9% increase from 2015.
As we saw in the quintile analysis of household incomes, mean (average) household incomes are rebounding, and the top two are at record highs. When we slice the data by age cohorts and look at median incomes, the trends continue somewhat. Both the 15-24 and 65+ age groups reached new peaks in 2016, and the declines for the other cohorts were lower than the 2015 figures.
For more precise quantification of household income declines in recent years, here is a table showing the peak income year for each age bracket, the 2016 income, and the percentage change since the peak.
How about the year-over-year changes from 2015 to 2016? The second chart above illustrates the change in incomes for five of the six cohorts. The good news is that 2016 has been a strong year for household income growth for all six.
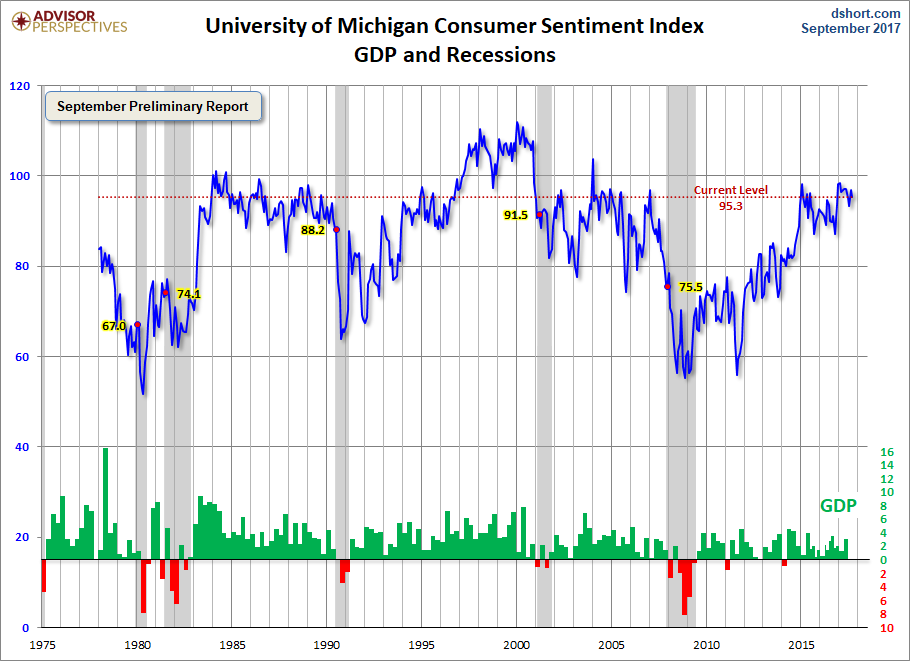
Here is a chart of the Michigan Consumer Sentiment, of which there is a general correlation to household incomes. It's clear that when household incomes are increasing, sentiment tends to be higher.
(Click on image to enlarge)
Here are links to the consumer and small business confidence indicators we track. They all have a conspicuous correlation with income data.
- Michigan Consumer Sentiment Index
- Conference Board Consumer Confidence Index
- Small Business Optimism Index
Implications for the Economy
In the 50-year history of this data series, there has never been such an ugly period of contraction since the Great Recession. The contraction ended shortly after the downturn, within a couple of years depending on the age cohort. The 2016 data gives hope that household incomes are continuing to increase at a sustainable pace.
For more information on the Census Bureau's Current Population Survey (CPS), visit the CPS Frequently Asked Questions page. A question we've often been asked over the years is what qualifies as income in CPS household survey. The CPS definitions page lists the following:
- Earnings
- Unemployment compensation
- Workers' compensation
- Social security
- Supplemental security income
- Public assistance
- Veterans' payments
- Survivor benefits
- Disability benefits
- Pension or retirement income
- Interest
- Dividends
- Rents, royalties, and estates and trusts
- Educational assistance
- Alimony
- Child support
- Financial assistance from outside of the household
- Other income



Comments
Log in or sign up to join the conversation.