
Measuring Unemployment
New claims for unemployment insurance this week came in at the lowest level in over 40 years. How much slack can there be left in the labor market?
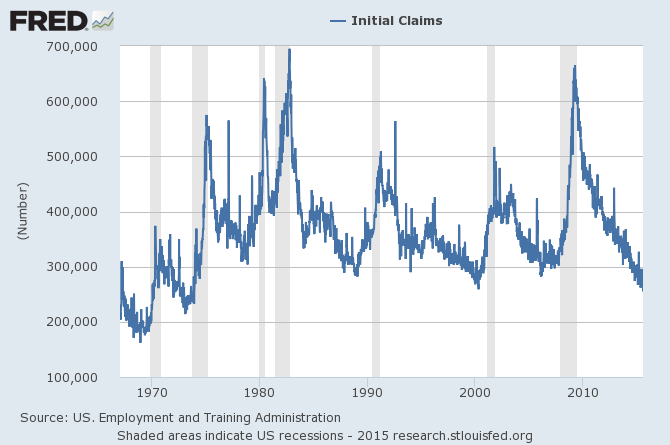
Initial claims for unemployment insurance, weekly, 1967-01-07 to 2015-07-18. Source: FRED.
The most common measure of unemployment (known as U3) counts the number of people who are not currently working and are actively looking for a job. You’re put in that category by the BLS if you report taking active measures over the last month to find work. In June U3 amounted to 5.3% of the labor force, where the labor force is defined as the sum of U3 plus people who are currently employed. That’s well below the average rate of 6.5% seen over the last 40 years.
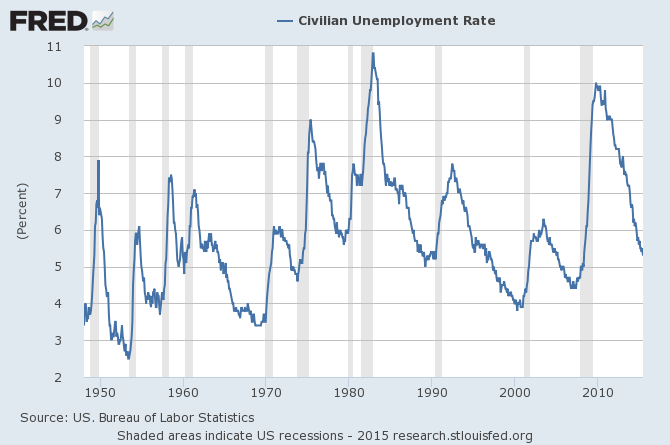
U3 unemployment rate, monthly 1948:M1 to 2015:M6. Source: FRED.
But if you simply count the number of people who are working as a percent of the population 16 years and over, you come up with only 59%. That’s up a little from the lows reached during the Great Recession, but significantly below what it had been over the last several decades.
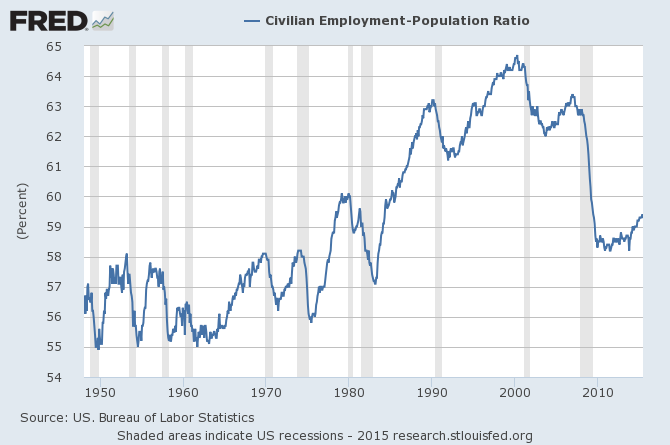
Source: FRED.
The difference between the last two graphs is explained by people who are not working but also are not counted as unemployed by the BLS. Most of these people don’t want a job because they are retired, disabled, in school, or other reasons. But there are a number of people who aren’t working, say they want a job, are available for work, and have taken measures within the past year to try to find work. But because they did not do anything active within the last month, they aren’t counted as “unemployed” or “in the labor force”. Instead they are designated by the BLS as “marginally attached to the labor force”. When these individuals are added to those counted as unemployed by the conventional designation, we get a measure of unemployment known as U5. The “marginally attached” are sometimes further broken down into those who say they didn’t search within the last month because they were discouraged about finding a job, and those who give some other reason.
And there are a number of people who say they’re employed, but only part-time, and are hoping to get a full-time position. When we add these to the U5 count, we get the broader unemployment measure known as U6. Last month the U.S. unemployment rate as measured by U3 was 5.3%, but when measured by U6, it came in at 10.5%.
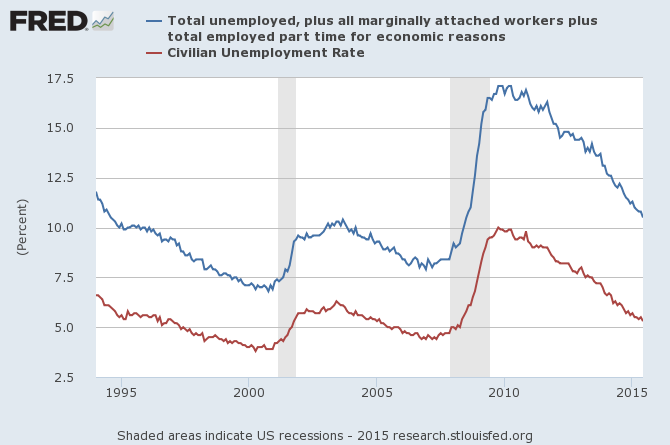
U.S. unemployment rate as measured by U3 (in red) and U6 (in blue), monthly, 1994:M1 to 2015:M6.
Which, if any, of these is the appropriate measure of labor market slack? Some recent research by Andreas Hornstein and Marianna Kudlyak from the Federal Reserve Bank of Richmond and Fabian Lange from McGill University suggested a useful way to try to answer this question. If we’re not sure how to interpret the answers people give to questions posed by the BLS, why not look at what those answers imply for what actually ends up happening? Of those people in U3 who have been unemployed for 26 weeks or less, on average over the 1994-2013 period 28% of them would find a job the next month. But of those included in U3 who have been unemployed for more than 26 weeks, on average only 14% of them would find a job the next month. For comparison, if we look at those designated as marginally attached to the labor force, 13% of them would typically find a job the next month. And of those who say they want a job but don’t report having actively searched within the last year, 14.5% would typically be employed the following month. These numbers suggest we should treat the “marginally attached”, and for that matter everybody who says they want a job even if they haven’t been actively looking for one, the same way we treat the long-term unemployed in U3.
|
Category |
Job Probability |
| unemployed | |
| ___less than 26 weeks |
28.0 |
| ___more than 26 weeks |
14.4 |
| not working, want a job | |
| ___ marginal discouraged |
13.1 |
| ___marginal other |
12.7 |
| ___not searching |
14.5 |
| not working, don’t want job | |
| ___disabled |
1.7 |
| ___retired |
1.4 |
| ___other, in school |
8.5 |
| ___other, not in school |
7.5 |
Historical probability that someone in indicated category will be employed the following month. Source: Hornstein, Kudlyak, and Lange (2014).
Of those who say they are not working, not looking for work, and not retired or disabled, about 8% on average would likely be working the next month.
These considerations led Hornstein, Kudlyak, and Lange (2014) to propose a Non-Employment Index that is a weighted average of all those who are not currently working with weights based on the average probabilities in the table above. A weight of one is given to those in U3 who have been unemployed for 26 weeks or less, a weight of about one-half to others in U3 and everyone else who is not employed but say they want a job, a weight of about one-quarter to non-employed students, and so on. Since one of the things we are doing with this index is changing the concept of what we mean by the “labor force,” the authors report their measure as a percent of the noninstitutional civilian population 16 years and over. For comparison I’ve plotted their NEI series in the graph below along with U3 and U6 unemployment as percent of the population. All the numbers in the graph are based on seasonally unadjusted data, from which I then calculated 12-month averages to get a quick seasonally adjusted series. I’ve added those employed part-time for economic reasons to the NEI for more direct comparability with U6. The graph shows that U6 unemployment rose faster during the Great Recession and came down more dramatically since than does either the narrower measure based on U3 or the broader measure based on NEI.
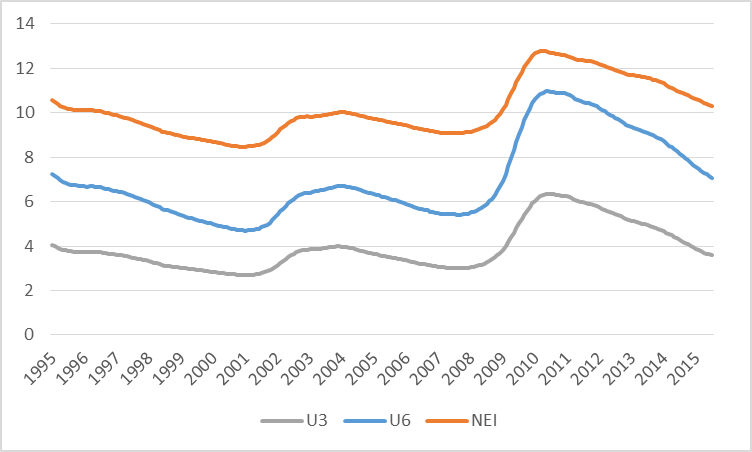
U3 unemployment, U6 unemployment, and NEI plus part-time employment for economic reasons as percent of noninstitutional population 16 years and over, averages of seasonally unadjusted values over preceding 12 months, 1995:M1 to 2015:M6.
What does this tell us about how tight the labor market is at the moment? One way we could try to answer that is to look at the historical relation between the conventional measure U3 and the new proposed NEI. I performed an analysis similar to those that the authors report in their paper, regressing seasonally adjusted U3 on a constant and seasonally adjusted NEI over the period 1994:M1 to 2007:M6. The fitted values of this regression are plotted in blue in the graph below, which closely track the actual values of U3 in black. I then asked, what values would we have predicted for U3 over the more recent period based on the historical relation? The answer is plotted as the dashed blue line. U3 unemployment was much higher over 2009-2013 than we would have expected based on the calculated value of NEI, but the two indicators have been back in line over the last year and a half.
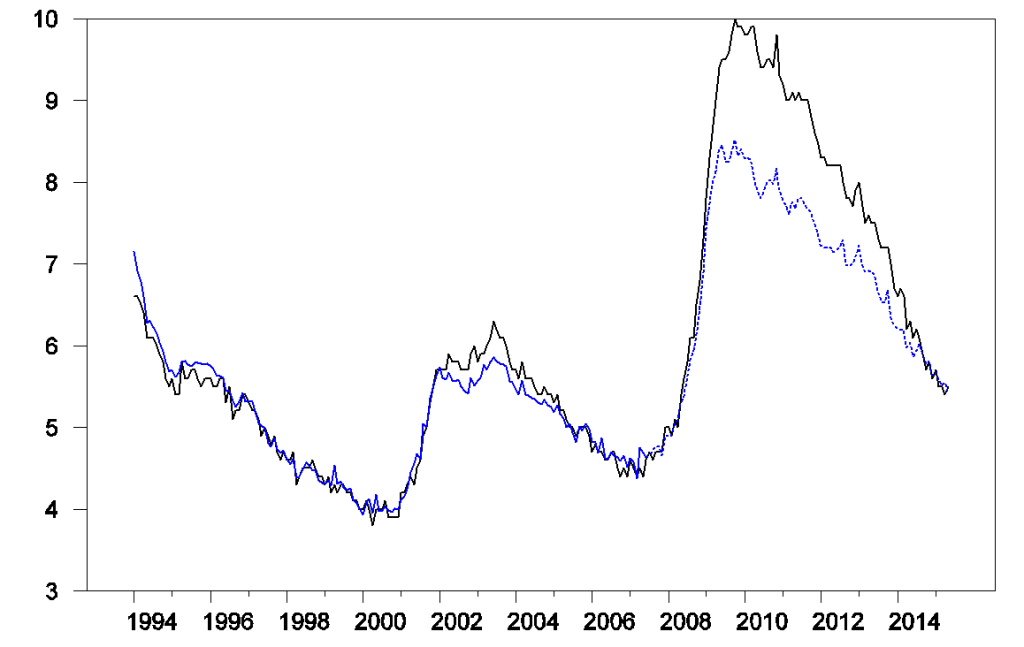
Seasonally adjusted values of U3 and predicted values from regression of U3 on NEI.
This is the opposite from the conclusion that many might have anticipated. The level of NEI is always higher than U3 at every date, but this does not mean that there is always more slack in the labor market than analysis based on U3 would predict. The question is whether the difference between NEI and U3 is bigger or smaller than usual. During the Great Recession, the difference was smaller than usual. Theauthors conclude:
Contrary to the extended BLS unemployment rates, we find that for the post-2007 period U3 actually overstates unemployment relative to the NEIs that exclude those working [part time for economic reason]. This break relative to the pre-2007 relation is due to the exceptionally large increase of long-term unemployment following the Great Recession. Since our NEIs down-weight long-term unemployed significantly relative to short-term unemployed, the NEIs increase less than U3 after the Great Recession.
It is interesting to relate this to another observation: inflation during and following the Great Recession came in higher than one would have predicted using a Phillips Curve based on the traditional measure U3– with U3 so high, it’s surprising that inflation did not drop more dramatically. A while back I discussed one possible interpretation of this based on the hypothesis that price-setters were slow in adapting inflation expectations to the changing environment. An alternative hypothesis is that the surge in long-term unemployment made U3 a less useful predictor of inflation. Evidence that short-term unemployment is a better predictor of inflation than U3 was provided by Stock (2011) and Watson (2014), though Kiley (2014) reached a different conclusion using state-level data.
If the Hornstein, Kudlyak and Lange measure is correct, then there is substantially less uncertainty about how to measure unemployment than many of us have been assuming. The first impression from traditional labor market indicators such as U3 and initial unemployment claims– namely, that we’re returning to a period of tightness in the labor market– is the correct one. And the period when forecasting equations based on U3 under predict inflation may have come to an end.
Disclosure: None


