
Markets Review | 22 October 2014
Welcome to the big snapback… so far. The prices of risky assets have made a huge U-turn in recent days. Battered and bruised has given way to robust and rising. It may turn out to be a fleeting resurgence, but the rebound looks impressive at the moment. US real estate investment trusts (REITs) in particular have delivered a rousing revival. But while most of the global markets have perked up, there’s been a notable exception: commodities, which in broad terms aren’t participating in the party.
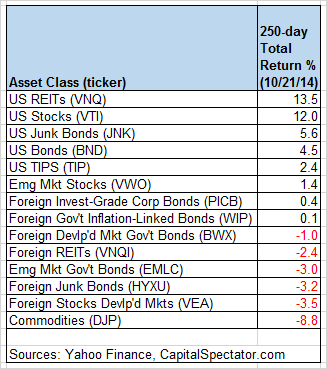
Based on our standard ETF proxies for the major asset classes, US REITs (VNQ) are in the lead with a 13.5% total return, based on the trailing 250 trading-day period (the rough equivalent of a one-year return). As noted, commodities are at the bottom of the barrel for trailing one-year performance. Indeed, DJ-UBS Commodities (DJP) has shed nearly 9.0% over the past year through yesterday’s close (Oct. 21).
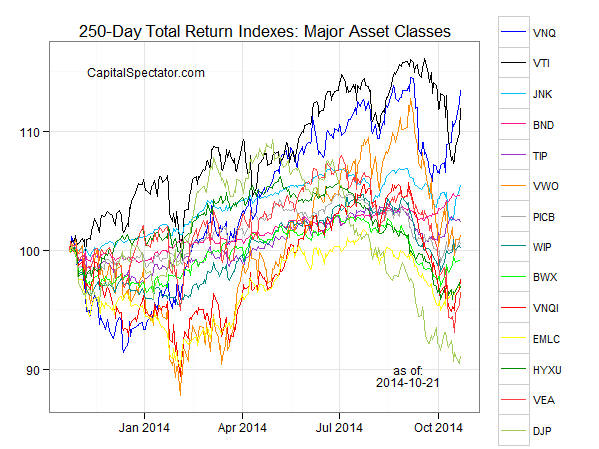
For a graphical recap, consider the relative performance histories for each of the major asset classes for the past 250 trading days via the ETF proxies. The chart below shows the performance records through Oct. 21, 2014, with all the ETFs rebased to 100 using a start date of Oct. 24, 2013:
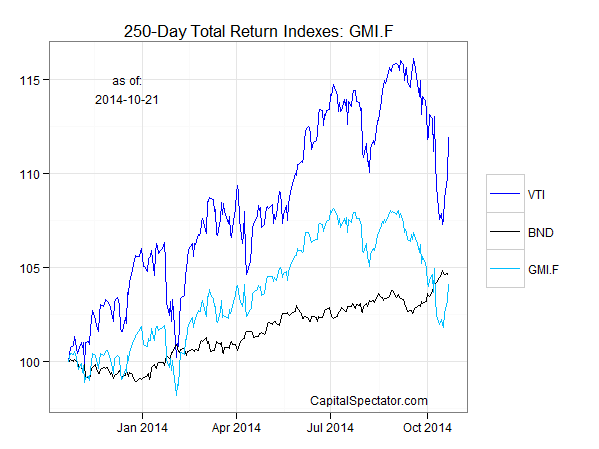
Next, let’s review an ETF-based version of an unmanaged, market-value-weighted mix of all the major asset classes — the Global Market Index Fund, or GMI.F, which is comprised of all the ETFs in the table above. Here’s how GMI.F stacks up for the past 250 trading days through Oct. 21, 2014. This investable strategy is up 4.1% over that period, which is below the equivalent performance for US stocks (VTI) and US bonds (BND).
Comparing the overall dispersion of returns for the major asset classes via ETFs suggests that the general rebalancing opportunity has improved a bit for GMI.F vs. recent history. The dispersion of 250-day returns for our set of ETF proxies has increased lately, rising off the extreme lows for last month. Analyzing the components of GMI.F with a rolling median absolute deviation based on one-year returns for the ETFs — the GMI.F Rebalancing Opportunity Index, as it’s labeled on these pages — suggests that there’s enhanced potential for adding value by reweighting this portfolio in comparison with the previous month. Keep in mind that the opportunity for productive rebalancing will vary depending on the choice of holdings and historical time window. In addition, don’t overlook the possibility that any given pair of ETFs may present a substantially greater or lesser degree of rebalancing opportunity vs. analyzing GMI.F’s components collectively, which is the methodology for the chart below.

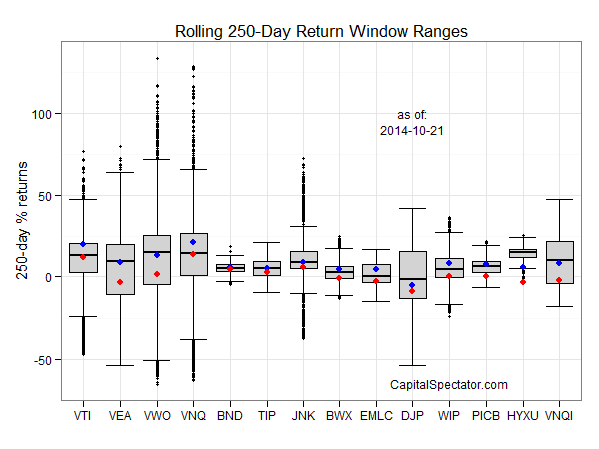
Finally, let’s compare the rolling 1-year returns for the ETFs in GMI.F via boxplots for a revealing comparison of price momentum. The gray boxes in the chart below reflect the middle range of historical 250-day returns for each ETF—i.e., the 25th to 75th return percentiles. The red dots show the current return (as of Oct. 21) vs. the 250-day return from 30 trading days earlier (blue dots, which may be hiding behind the red dots in some cases). Although recent one-year performance records have taken a hit lately, they’ve made a decent comeback in recent days. The question, of course, is whether the recovery will roll on? Mr. Market has the answer, but as usual he takes his sweet time sharing the information with the crowd.
Disclosure: None.


