
Markets: Margin
On the margin, mood for risk-taking is better today. Some see this stability as emanating from the CNY holding a dull range (fixed at the best level in 3-weeks) and not rocketing through 7 despite weaker equities and lower rates. Some see it in the benign Chinese PPI-CPI combination that supports margins that shows no real impact on inflation from the weaker CNY or trade tariffs. Others see risk coming back with the normalization of correlations, in the return of bonds offsetting stocks, as oil prices steady and as the FX markets return to real rate watching. Overnight economic data clearly mattered – with NZD the winner in the G10 space up 0.35% - as CPI surprised to the upside but volatility didn’t follow.
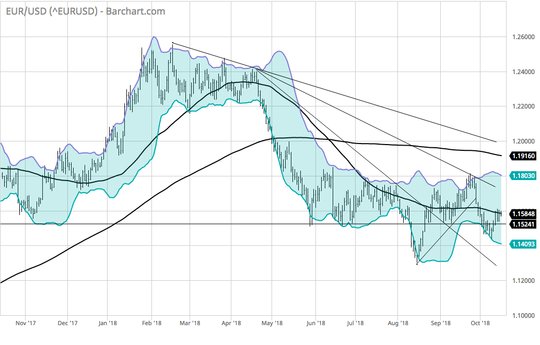
On the negative side, the EUR is lower barely, mostly thanks to the weaker German ZEW and ignoring the noise over the Italian budget law approval and the relief rally in BTPs. UK Brexit talks and deadlines loom but main focus remains on the politics after it all with GBP higher today but on the 2-day window stuck in a range. The markets are searching for some marginal good news in the US to support this rally back up in equities with no on particularly excited about trading. For the money, CNY and NZD maybe the ones that matter but the mood for more noise is wrapped around the EUR with the risk of 1.14 still lingering over politics and budgets while 1.18 seems more a ceiling if we see it again soon. All that suggests trouble remains in store for those facing margin calls in equities.
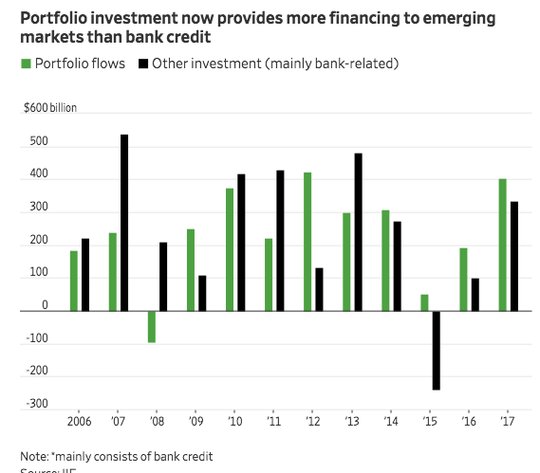
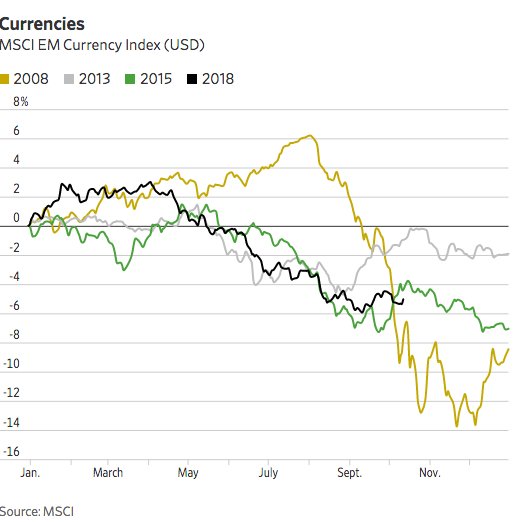
Question for the Day:Is it safe yet for EM? The relative calm in CNY and the benign reaction to PPI and CPI have helped to steady markets globally. The key question is whether this is sufficient to buy this dip. The WSJ has an interesting chart to consider as to why this time its different. Worth considering what factors have made 2018 so much worse than previous sell-offs and whether those factors have reversed here. 1) Rates in the US are still going up. 2) Trade issues are not yet resolved. 3) FX and other monetary policies aren’t fully in line in many EM countries. 4) Global growth for 2019 remains in doubt. This maybe the story that just won’t go away and so perhaps calm is not equal to safe.
What Happened?
- New Zealand 3Q CPI up 0.9% q/q, 1.9% y/y after 0.4% q/q, 1.5% y/y – more than 0.7% q/q, 1.7% y/y expected. This was higher that the 0.5% q/q, 1.8% y/y forecast from the RBNZ as well. The RBNZ sectoral inflation model for 3Q was unchanged at 1.7% y/y. Tradable inflation rose 0.9% q/q while non-tradable 0.8% q/q.
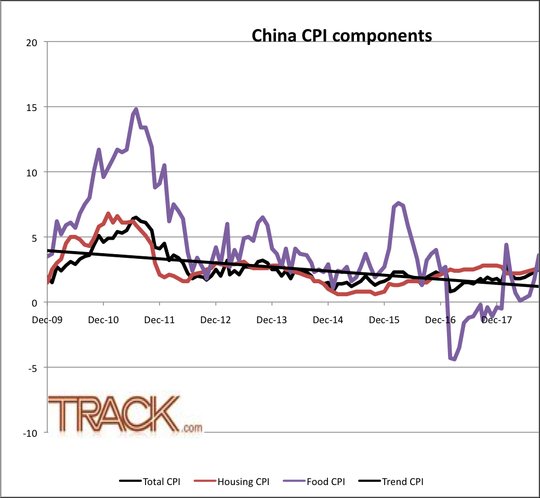
- China September CPI up 0.7% m/m, 2.5% y/y from 2.3% y/y – as expected – highest since February. Food prices rose 3.6% y/y from 1.7% y/y, non-food rose 2.2% y/y after 2.5% y/y. Housing rose to 2.6% from 2.5%. Notable declines in health care 2.7% from 4.3%, and other articles/services 0.7% from 1.2%. Only food/tobacco/alcohol rose to 3% from 1.9% and transport/communications 2.8% from 2.7%.
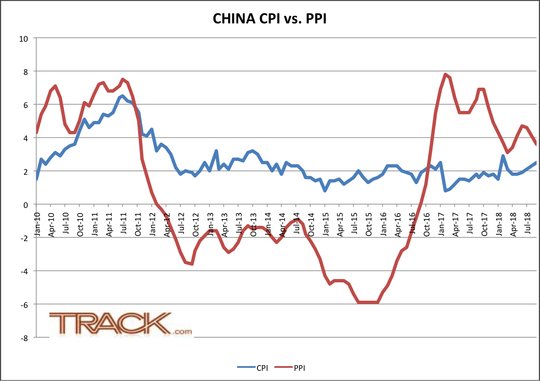
- China September PPI slows to +0.6% m/m, 3.6% y/y after 4.1% y/y – as expected. For the year-to-date PPI 4% same as August. Only food showed a price gain up 0.9% y/y after 0.7% while the biggest drops were in ferrous metals 5.1% from 6.2% and non-ferrous metals -0.4% from +2.5% y/y. Overall, mining and exploration was 11.7% from 1.2.1% and raw material procurement 4.2% from 4.8%. The fuel and power costs fell to 9.2% from 9.7% despite higher crude oil prices in September.
- Australia RBA meeting minutes: Next rate move likely higher but no immediate need to change. The Bank also noted that the depreciation in the A$ was likely helpful for economic growth, and that data point to solid GDP growth in Q3, although growth will likely to moderate from the pace observed in H118. The Bank still remained cautious stressing that uncertainty surrounding the consumption outlook is still an important consideration. Members noted that developments in trade policies continued to pose significant risks to this outlook.
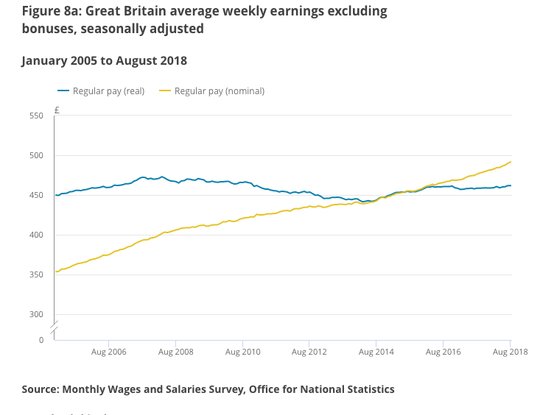
- UK Aug 3M ILO unemployment rate steady 4% but employment falls 5,000, wages up – net mixed to expectations. This was the first drop in jobs in 3M basis since Oct 2017. The average total earnings rose to 2.7% from 2.6% - more than the 2.4% expected – while ex-bonus earnings rose to 3.1% y/y from 2.9% - also more than 2.8% y/y expected – and fastest wage gains since 4Q2008. Breaking the wages by sector, total services sector pay was the highest since the 3m to July 2015 while regular public sector pay hit a 6-year high. Real regular wages rose by an annual rate of 0.7%, the fastest growth since Q4 2016. The September claimant count rose 18,500from 8,700 – worse than the 8,000 expected – suggesting more slack in the labor market.
- Eurozone August trade surplus E16.6bn from E12.7bn – better than E14.1bn expected. Exports up 2.1% m/m, 5.6% y/y while imports were unchanged m/m, +8.4% y/y. The overall EU trade with the US showed exports up 6.4% to E265bn in Jan-Aug 2018 while imports rose 0.4% to E175.1bn, trade with China showed exports up 5.3% to E136.3bn and imports up 3.1% to E52.1bn.
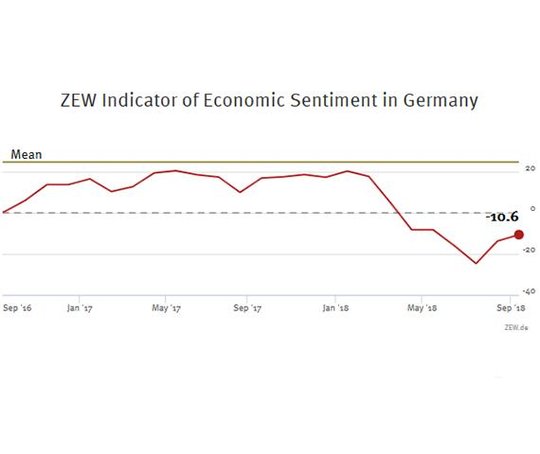
- German October ZEW economic sentiment -24.7 from -10.6 – much worse than -12 expected. The current conditions 70.1 from 76 – weaker than 74 expected. The Eurozone sentiment also fell sharply, off 12.2 points to -19.4 – weaker than -9.1 expected. The current conditions improved 0.3 to 32 points. “Expectations for the German economy are dampening above all due to the intensifying trade dispute between the USA and China. The resulting negative expectations on German exports are now beginning to show in the actual development of exports. A further negative influence on economic and export expectations is the danger of a ‘hard Brexit’, which is becoming ever more likely. Last but not least, the situation of the governing coalition in Berlin is perceived to have become more unstable, which also weighs on economic sentiment,” noted ZEW President Achim Wambach
- German August import prices unchanged m/m, +4.8% y/y while export prices rose 0.2% m/m, 2.1% y/y from 1.9% y/y.The August import prices by category were mixed – oil -1.2% m/m, nat-gas up 0.4% m/m, petro products +1.7% m/m while the ex-oil products were 0% m/m, +2.5% y/y. Overall, energy import prices are up 33.2% y/y.
Market Recap:
Equities: The US S&P50 futures are up 0.3% after losing 0.59% yesterday. The Stoxx Europe 600 rose 0.4% - best gain in 2-weeks – led by Italy on budget fear relief. The MSCI Asia Pacific rose 0.5% even with China lower.
- Japan Nikkei up 1.25% to 22,549.24
- Korea Kospi flat at 2,145.12
- Hong Kong Hang Seng up 0.07% to 25,462.26
- China Shanghai Composite off 0.85% to 2,546.33
- Australia ASX up 0.5% to 5,977.80
- India NSE50 up 0.69% to 10,584.75
- UK FTSE so far off 0.3% to 7,009
- German DAX so far up 0.2% to 11,638
- French CAC40 so far up 0.1% to 5,099
- Italian FTSE so far up 1.1% to 19,498
Fixed Income:
- Germany sold E3.028bn of 2Y 0% Sep 2020 Schatz at -0.56% with 1.81 cover –previously -0.54% with 1.9 cover – after Bundesbank holdings cover rises to 2.4 same as previously.
- Finland sold E1bn of 10Y 0.5% Sep 2028 RFGB at 0.728% with 1.6 cover– previously 0.62% with 4.3 cover.
- Spain sold E2.667bn of bills at lower rates with good demand– E0.278bn of 3M Jan 2018 Letra at -0.649% with 8.4 cover- previously -0.485% with 5.2 cover – and E2.39bn of 9M July 2018 Letra at -0.307% with 2.5 cover – previously -0.385% with 2.9 cover.
- US Bonds lower with risk-on return in equities with belly of curve focus– 2Y up 1bps to 2.866%, 5Y up 2.1bps to 3.03%, 10Y up 1.7bps to 3.173%, 30Y up 1.7bps to 3.353%
- Japan JGBs hold tight ranges, watching equities, US/China- wY up 0.4bps to -0.122%, 5Y up 06bps to -0.071%, 10Y up 0.8bps to 0.14%, 30Y up 0.2bps to 0.903%. The MOF sold Y1.637trn of 5Y 0.1% reopened #JB137 JGBs at -0.055% with 4.883 cover – previously -0.069% with 5.534 cover.
- Australian bonds sold with risk-on, NZ CPI, but RBA minutes ignored- 3Y up 0.5bps to 2.045%, 10Y up 2bps to 2.707%.
- China PBOC skips open market operations, leaves liquidity unchanged. Money market rates were lower with 7-day off 2bps to 2.581% and O/N off 1bps to 2.353%. 10-year bond yields were off 1.5bps to 3.575%.
Foreign Exchange: The US dollar index is flat at 95.09 with range 94.97-95.20. In Emerging Markets – USD mostly offered– EMEA: ZAR up 0.5% to 14.30, TRY off 0.1% to 5.79, RUB up 0.25% to 65.505; ASIA: TWD up 0.15% to 30.85, KRW up 0.55% to 1128 and INR up 0.25% to 73.635.
- EUR: 1.1570 off 0.1%. Range 1.1566-1.1599 with German ZEW, rates back in play despite Italy relief.
- JPY: 112.05 up 0.25%.Range 111.73-112.17 with EUR/JPY up 129.70 up 0.2% - focus is on equities, rates still with 112.50 resistance.
- GBP: 1.3215 up 0.5%.Range 1.3141-1.3222 with EUR/GBP .8755 off 0.5% - unwinding some Brexit deal fears – but waiting for deadlines with 1.3250-1.3300 still key resistance zone
- AUD: .7125 off 0.1%.Range .7112-.7144 with focus on NZD, crosses and China shares – NZD up 0.45% to .6580 with .6620-40 resistance next all about CPI.
- CAD: 1.2970 off 0.15%.Range 1.2969-1.2999 with rates and crosses driving – Mexico steel quota talk worth watching for 1.2950 base and 1.3050 retest.
- CHF: .9885 up 0.1%.Range .9865-.9898 with EUR/CHF 1.1440 up 0.1% - focus is on JPY and Italy moving with .9850-1.00 $ consolidation.
- CNY: 6.9119 fixed 0.05% stronger from 6.9154, trades stronger to 6.92 into London from 6.2970 yesterday close.
Commodities: Oil lower, Gold higher, Copper off 1.15% to $2.8275.
- Oil: $71.07 off 1%.Range $71.02-$72.04. Consolidation mode with base at 55-day $69.37 and $70 holding but $75 resistance far away. Brent $80.05 off 0.90% - restesting $80 support with focus on $78.80 next. Saudi story unwinding, API next focus.
- Gold: $1228.40 up 0.1%.Range $1226-$1229. Gold watching base at 55-day $1201 and $1215 against $1236 and then $1250. Silver up 0.4% to $14.75 - watching 55-day as support at $14.614 then $14.50 pivotal base with $14.91 and $15.00 next bull targets. Platinum up 0.3% to $845 and Palladium up 0.15% to $1087.
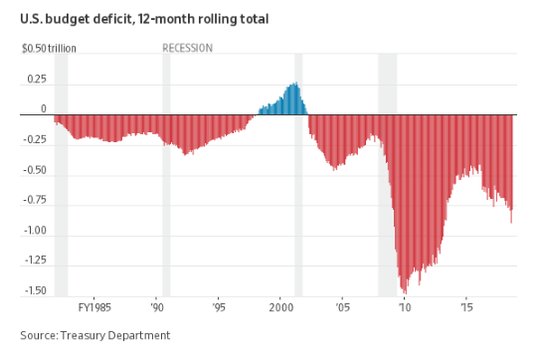
Conclusions: Do deficits matter? The Treasury released its fiscal year-end budget yesterday showing the deficit rose 17% the most in 6 years. In USD terms the spending led the deficit but in GDP terms it’s about the tax cut increasing the burden. Tax revenues were flat. The chart suggests that the 4% GDP hasn’t yet led to enough of a pickup in new tax revenues. If we continue to see growth not being enough watch out, then deficits matter.
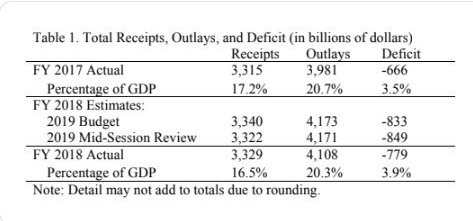
Either way, the US seems headed to a $1trn budget deficit and the mid-term elections don’t highlight this as an issue.
Economic Calendar:
- 0800 am Hungary central bank rate decision no change from 0.9% expected
- 0915 am US Sep industrial production (m/m) 0.4%p 0.2%e / Cap Utils 78.1%p 78.2%e
- 1000 am US Aug JOLTs job openings 6.939mn p 6.90mn e
- 1000 am US Oct NAHB housing market index 67p 68e
- 0400 pm US Aug net TIC flows $52.2bn p $20bn e / long term $74.8bn p $48bn e
- 0430 pm US weekly API oil stats 9.75mb p 2mb e
View TrackResearch.com, the global marketplace for stock, commodity and macro ideas here.


