
Market Internals; Prelude To A Crash? Part 2
The following is an excerpt from the Market Sentiment & Internals segment of the this week's edition of Notes From the Rabbit Hole.
Up Volume has been draining and market breadth has been fading (ref. NYSE Advance/Decline page 10). This is a far cry from the Breadth Thrust we noted in the summer (thank you again to subscriber LN). Per LN’s analysis, the implication was for a temporary rally then further evaluation with the potential for some very bearish activity similar to 1987 (ref. Breadth Thrust: Prelude to a Crash? posted on July 12).
Since then we have been good TA Robots, following the larger trend to remain bullish beyond the current corrective phase. But I trust you will not over react to this little reminder of where we were at back when the whole world was bearish. We were bullish short-term and not at all sure about that stance beyond the breadth surge phase.
Sentimentrader notes a decline in breadth since the big summer surge and goes on to project data from over sold breadth conditions (it’s not quite over sold yet as Up Volume has just ticked below 45% with over sold being 40% or below, based on the 10 day average) that is in their word “blah”, in that there is no real historical tendency toward bullish or bearish after such a signal.
But I want to introduce it as new information pertaining to our original breadth thrust work. I believe breadth can get significantly more over sold before any contrarian bull signals come about. What’s more, should the market lose the major support levels we are managing, the view could get very bearish and very high risk.
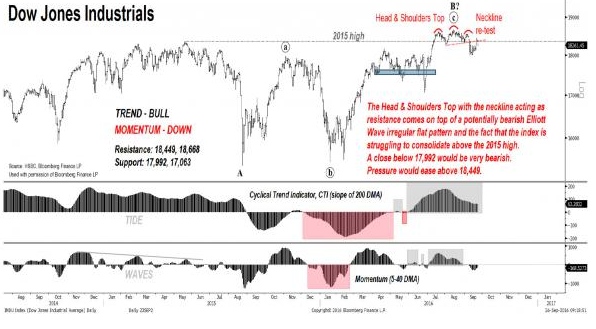
As luck would have it, while writing the latter parts of this report, including the 1987 Breath Thrust material above, subscriber Claudio emailed asking if I can comment on some HSBC/Citigroup comparisons of the current situation to 1987. HSBC’s Murry Gunn, as highlighted at Zero Hedge, warns of his view of “ominous shades of 1987” for the markets. Let’s look further…
This was actually presented first at Bloomberg http://bloom.bg/2e8i365 on 10/12/16.
Yesterday’s big stocks drop may have just been the beginning.
Or so says HSBC Holdings Plc technical analyst Murray Gunn. In a new note, Gunn says he is now on alert for a big dip in U.S. equities. “With the U.S. stock market selling off aggressively on October 11, we now issue a RED ALERT,” he writes. “The possibility of a severe fall in the stock market is now very high,” he adds, noting that volatility has continued to rise since the end of the summer and the recent sell-off was seen across many areas of the market, and not just select groups.
The key levels that Gunn and his team are watching are 17,992 in the Dow Jones Industrial Average and 2,116 in the S&P 500. (As of 10:15 a.m. in New York, the Dow was trading at 18,147 and the S&P 500 at 2,140.) “As long as those levels remain intact, the bulls still have a slight hope,” they write. “But should those levels break and the markets close below (which now seems more likely), it would be a clear sign that the bears have taken over and are starting to feast,” they conclude.
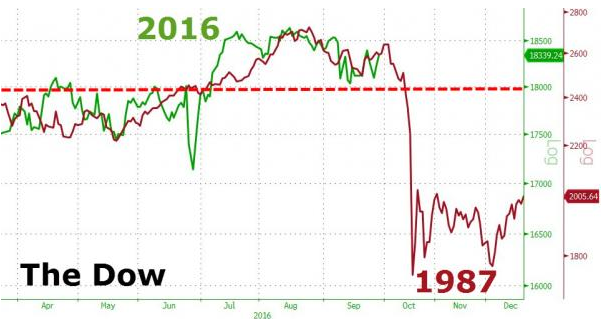
Jumping the HSBC bandwagon, Zero Hedge adds these charts, imagining an H&S top.
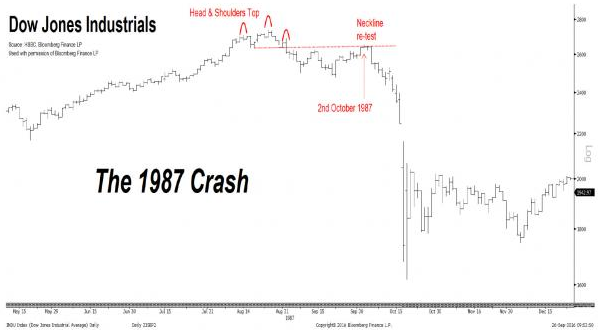
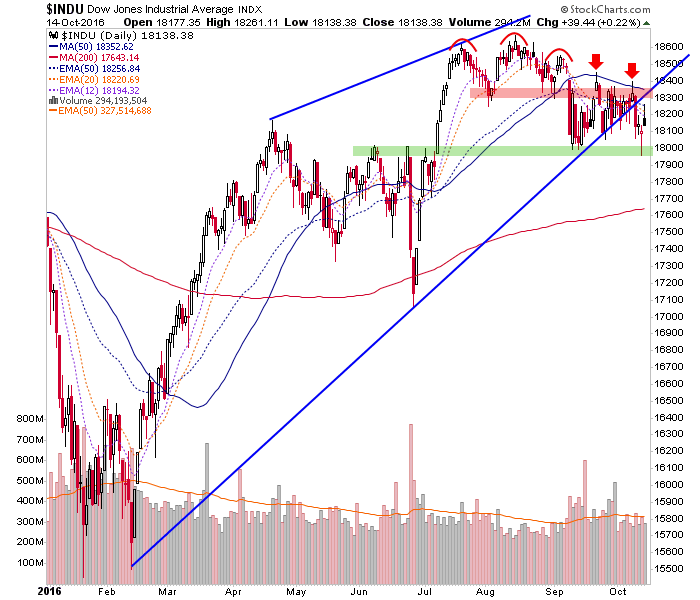
First of all, if that is an H&S, it is tiny, of only short-term significance and it measures to 17,900 or so, which has already been approached. Dow has hit key support but transferring the metrics used on the S&P 500 to the Dow, we allow for a test of the SMA 200 (currently 17,643) under the long-term bullish trend.
Contrary to the hype above (isn’t it perfect that a media piece highlighting a credentialed TA “and his team” * shows up in October?). Folks, the ZH stuff is pure analog analysis, which all too often does not work out, and the HSBC stuff is media hype.
* Picture a cluster of cubicles apart from the mainstream. In that little office village exists the technical analysis “team” at HSBC. They are separate from the mainstream analysts because quite frankly, mainstream analysts, traders and stock salesmen/pitchmen are the real backbone of the company. Everybody knows the TA group (of nerds) is only there to come up with whacky conclusions from drawings that can be fed to the media once in a while for some good headline material. Seriously, a friend who used to be in the business once told me that the TA’s were laughed at, mocked and derided within his firm. I totally believe it.
Remember the 1929 analog that was going around a few years ago, courtesy of Tom McClellan? I think he presented it without much hype but the media grabbed it (MarketWatch first, as I recall) and the thing spread like wildfire across the blogosphere. Well, to little surprise it did not work out for the bears. The 3rd Zero Hedge chart above is pure analog promotion, and that is all it is.
So per Claudio’s request, I’ll comment on what I think of the above.
I think nothing of it whatsoever. I think that usually this fear mongering at sensitive times ultimately proves bullish. I also think that we, not the team of nerds at HSBC, became cautious about a corrective period in the market weeks ago. That caution was for a test of major support (SPX 2100 +/-) with no further conclusion about whether or not a big bear phase will ensue.
Test (noun): a procedure intended to establish the quality, performance or reliability of something, especially before it is taken into widespread use
- The Dow is short-term Bearish, against which we have had caution (using the S&P 500 as the primary guide).
- After making a higher high (to April) in the summer, the Dow is and will be in an uptrend as long as the June low is not taken out.
- Key resistance on the upside is and has been the 50 day simple moving average, which coincides with visual overhead resistance.
- The Dow has so far held the upper end of the visual support zone that extends all the way down to 17,600 or so.
- So backing out the scary talk by the TA nerd/media complex during what the media like to tout as the scariest time of year let’s note that the stock market is bearish right now.
- That bearishness would then bring the market to a test… of the bullishness of its long-term trend.
- Per the ‘Prelude to a Crash’ link above, we (with LN’s help) projected short-term bullish potential but with a potentially bearish resolution when the surge peters out. Now, after weeks of correction it’s the Revenge of the Nerds!
- Tune them out. They are clowns muckraking in the media.
- The plan has not changed in the least, scary analogs with baby H&S or not. The plan remains as follows…
Brexit hysteria addresses over bullish sentiment, putting it at extremes the other way. We get bullish, but guardedly so. That is because the market is running on sentiment now. Brexit relief, Election anxiety, Fed relief, Fed anxiety and the media in there confusing us (under the guise of guiding us) every step of the way. The test is upcoming, I hold some strategic long positions and am hedged accordingly until the smoke clears.
The Market Internals segment then continued with some of its more standard views that we cover each week.
Disclosure: Subscribe to more


