
Market Insanity Reaches Record Highs As Investors Flock Into The Biggest Bubble In History
Investors have forsaken all reason, logic and wisdom by rushing into the biggest stock and financial bubble in history. Even some precious metals investors are selling their gold and jumping into the markets hoping to make big profits as President Trump takes over the White house in six weeks.
Unfortunately, the worst time to jump into a market is when everyone else is doing the same thing. Of course, this doesn’t mean the Dow Jones Index won’t continue higher for some time, but the fundamentals of the economy continue to rot from the inside out.
No one really notices this as automobile dealers are now selling cars with zero interest rates, nothing down and no payment for 6 months. If this is the sort of business model the automobile industry has to resort to in order to continue sales, we are in big trouble.
Then we have these few headlines pointing to a worsening U.S. economy:
Restaurant Industry, Leading Indicator of US Economy Sours, Bankruptcies Pile up
ESPN Loses A Record 621,000 Subscribers In One Month
Greenspan: Western World Headed for a State of Disaster
The Housing Market Is Waving A Red Flag
These are just some of the many headlines pointing to an economy and stock market that is not heading towards better times. It was interesting to read that ESPN lost 621,000 subscribers in one month. However, ESPN has lost over 15 million subscribers in the past five years.
Market Insanity Pushes The Dow Jones Up To Tulip Mania Heights
I wrote about the 17th century Holland Tulip Bubble in a previous article:
Nothing has changed since the 17th century Tulip Bubble that also destroyed the ability of people to act rationally. At the peak during the Holland Tulip Mania, some tulips were selling for 10 times the annual income of a skilled craftsman (Source: wikipedia)
According to Wikipedia about the Tulip Mania:
…. the growing popularity of tulips in the early 17th century caught the attention of the entire nation; “the population, even to its lowest dregs, embarked in the tulip trade”.[6] By 1635, a sale of 40 bulbs for 100,000 florins (also known as Dutch guilders) was recorded. By way of comparison, a ton of butter cost around 100 florins, a skilled laborer might earn 150 florins a year, and “eight fat swine” cost 240 florins.[6] (According to the International Institute of Social History, one florin had the purchasing power of €10.28 in 2002.[35])
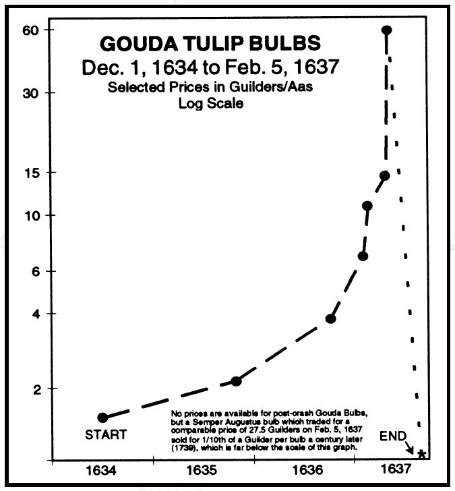
As we can see from the chart, investors lose all economic and financial sense when asset prices start to go insane. Instead of using some restraint and wisdom, they drop all reason and jump in on the rising bandwagon.
Again, the worst time to get into a market is when everyone else is jumping in with both feet. I have updated my chart showing the increase in U.S. Debt vs the Dow Jones Index since the first quarter of 1980:
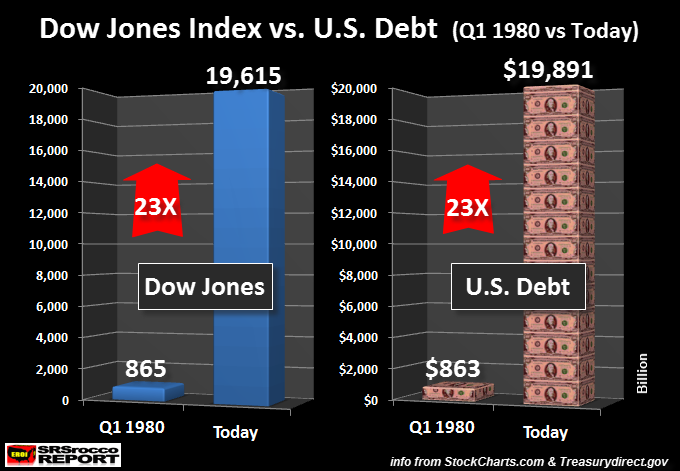
In 36 years, the Dow Jones Index and the U.S. Debt have increased at the same exact ratio… 23 TIMES. This is no mere coincidence. Investors who have parked their hard-earned money into market have placed their bet on stocks that are backed by nearly $20 trillion in U.S. debt.
So, there is a race for either the Dow Jones or U.S. Debt to reach the 20,000 mark first. I put my money on the U.S. Debt, which is only $100 billion away from that goal.
NOTE: The U.S. Debt chart is shown in billions.
Furthermore, the U.S. Retirement Market is up 24 TIMES since 1980, and the S&P 500 is up nearly 21 TIMES. So, we can clearly see that the massive increase in debt has provided the HOT AIR that has pushed the stock market up to Tulip Mania heights.
Now, if we go back to 1929 when the U.S. was in another huge financial and economic bubble, the situation wasn’t as INSANE as it is today:
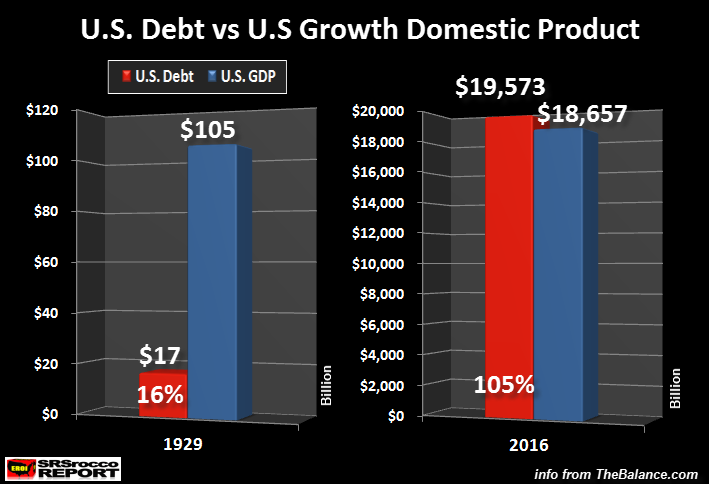
In 1929, right before the Great Depression hit, the U.S. debt was $17 billion versus a $105 billion Gross Domestic Product (GDP). Thus, the U.S. debt accounted for 17% of the U.S. GDP. If we fast forward to today, it is a much different picture.
The U.S. Debt is now 105% of the U.S. GDP. Basically, the U.S. economy is powered debt… and a lot of it. President Elect Trump may have grand ideas for the U.S. economy, however his hands will be tied by the massive debt and terrible energy predicament overhanging the country.
According to the sources I have read, nearly 10% of U.S. oil production is being produced by either bankrupt or financial challenged energy companies. I also mentioned in a prior article that the largest oil company in the U.S., ExxonMobil, had to borrow $8 billion in 2015 to pay dividends or CAPEX. Number two Chevron had to borrow even more at $18 billion to pay dividends and CAPEX in 2015.
This is not a good sign for a healthy market to invest in.
Unfortunately, this will not stop more precious metals investors from selling their gold to play in the Dow Jones Casino. The reason to hold onto precious metals is to protect oneself when the FAN FINALLY HITS THE COW EXCREMENT.
Who sells their homeowner or automobile insurance to play in the stock market? This is how insane the mentally of investors has become.
While I have no idea of the timing of the U.S. Financial and Economic Crash, the wise thing to do is to make sure one holds onto their “Precious Metals Insurance.”
Disclosure: None.


The most insane thing I have seen just within the last few days is a number of permabears--some well known, some a bit more obscure--expressing more bullish stances. Even Harry Dent said on Futures Now that he thought there could be another 10-20% upside in the market before a "Great Reset" later in 2017. When Harry Dent, Marc Faber, etc. start getting bullish (or at least *less* bearish), I start to wonder if it's time to sell everything.