Market Fireworks Still Blazing
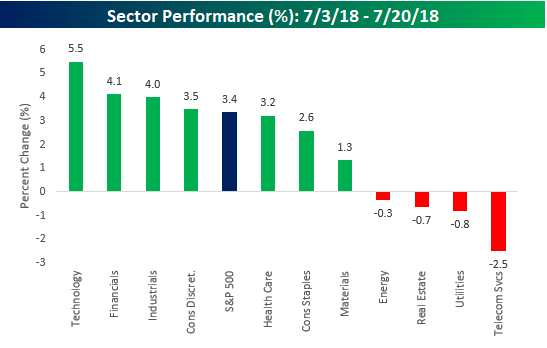
Heading into the July 4th holiday, US equities were in a bit of a funk with the S&P 500 down nearly 3% from its recent high in June. The July 4th holiday must have been just the rest the bulls needed, though, because since then the S&P 500 has gone on to make a higher high with eight daily gains in the eleven trading days since July 4th. So, which sectors have been behind the market’s recent strength? Leading the way higher has been Technology (what else is new?), which is up over 5%. Behind tech, though, Financials and Industrials have been noticeable outperformers while Consumer Discretionary is just barely outpacing the S&P 500. On the downside, four sectors are actually down during the S&P 500’s recent rally, with Telecom Services acting as the largest drag with a decline of 2.5%.
In terms of individual stock performance, gains have been pretty broad-based. For the Russell 3000, 64% of stocks in the index are positive since July 4th and the average stock is up 1.68%. In the S&P 500, however, performance has been even more positive with the average stock up 2.44% and three out of four stocks in the index posting gains. So, large caps have definitely been leading of late. In the tables below, we just wanted to quickly run through what have been some of the best and worst performing stocks since July 4th.
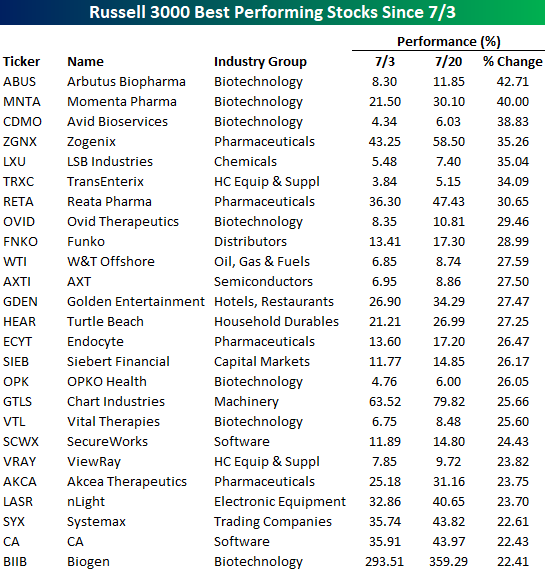
We’ll start with the Russell 3000.The table below lists the index’s 25 best performing components since the close on July 3rd. Looking at this list, there are three things worth highlighting. First, all of these stocks have had big gains in a short period of time. Second, most of them, you have probably never even heard of. Third, it’s been a good month for Drugs and Biotech. Of the 25 names listed below, eleven of them are either biotechs or pharma stocks. Another stock we wanted to point out was Turtle Beach (HEAR). Back on July 3rd, we highlighted this stock as the best performing stock in the Russell 3000 YTD as it had already returned 1,050%. Since that post, the stock has rallied another 27% taking its total YTD return to 1,400%. How’s that for compounding? Even more surprising is that even after a 14-bagger, the company’s market cap is less than $400 million.
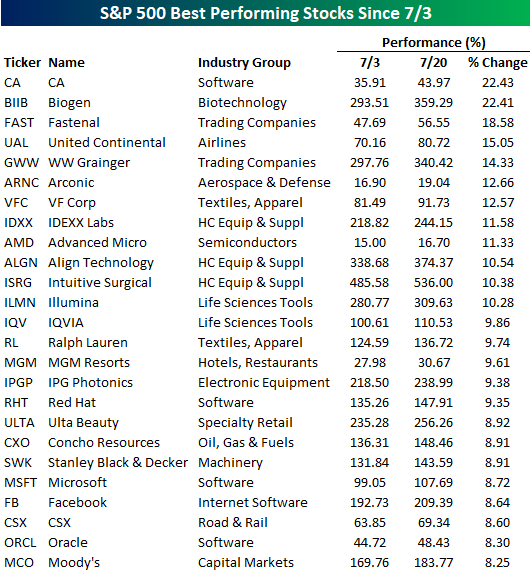
Since you’ve probably never heard of most of the names above, in the table below we list the 25 best performing large-cap S&P 500 stocks since 7/3. These stocks haven’t seen quite as impressive gains as the stocks in the table above, but all of them are up over 8%, which isn’t bad for a little over two weeks. Topping this list with gains of more than 20% are CA and Biogen (BIIB), which were also both on the list above.behind these two, another ten stocks are up over 10%. With all the talk about how FANG is carrying the market lately, it is worth noting that the only one to make the list was Facebook (FB).
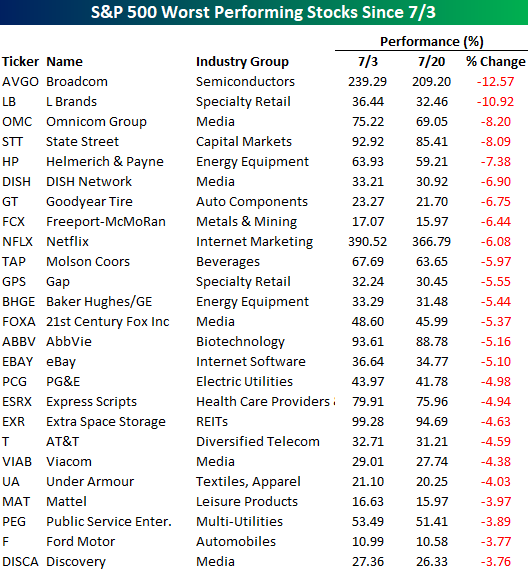
Finally, not to end on a bad note, but the stocks listed below are the 25 worst performing S&P 500 stocks since the July 4th holiday. As mentioned above, breadth for the stocks in the S&P 500 has been strong, so there haven’t been a whole lot of big losers. Of the 25 biggest dogs in the index, just two are down more than 10% (Broadcom-AVGO and L Brands-LB). The most notable stock listed, however, is Netflix (NFLX). After a run in 2018 where the stock more than doubled, NFLX’s weak earnings report on Monday, hit the stock hard. While NFLX did recover a bit of its initial weakness on Tuesday, it hasn’t been able to really catch its footing since.