
Market Divergence
- SPX Monitoring purposes; Long SPX on 10/22/18 at 2755.88.
- Monitoring purposes Gold: sold 11/27/18 at 18.88=gain .075%; Long GDX at 18.72 on 8/17/18
- Long-Term Trend SPX monitor purposes; Long SPX on 10-19-18 at 2767.78
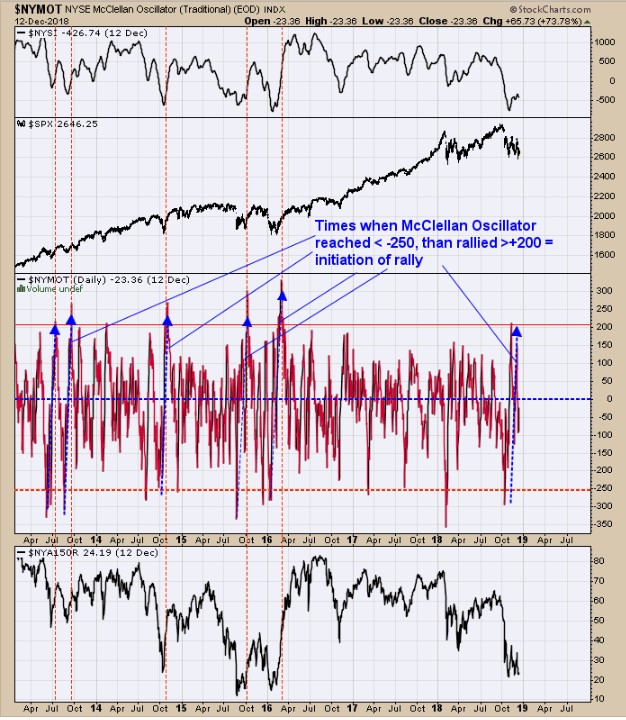
The chart above shows the times when McClellan Oscillator fell below -250 then rallied above +200; when that happens it implies an initiation of an up-move. There can be short-term consolidation (like now) before the market rallies to a new short-term high. It appears the market is set at a low but may not come off this low until the FOMC meetings. Putting it in another way, if the market is near this level going into the FOMC meeting, then the catalyst for the rally could be the FOMC meeting.
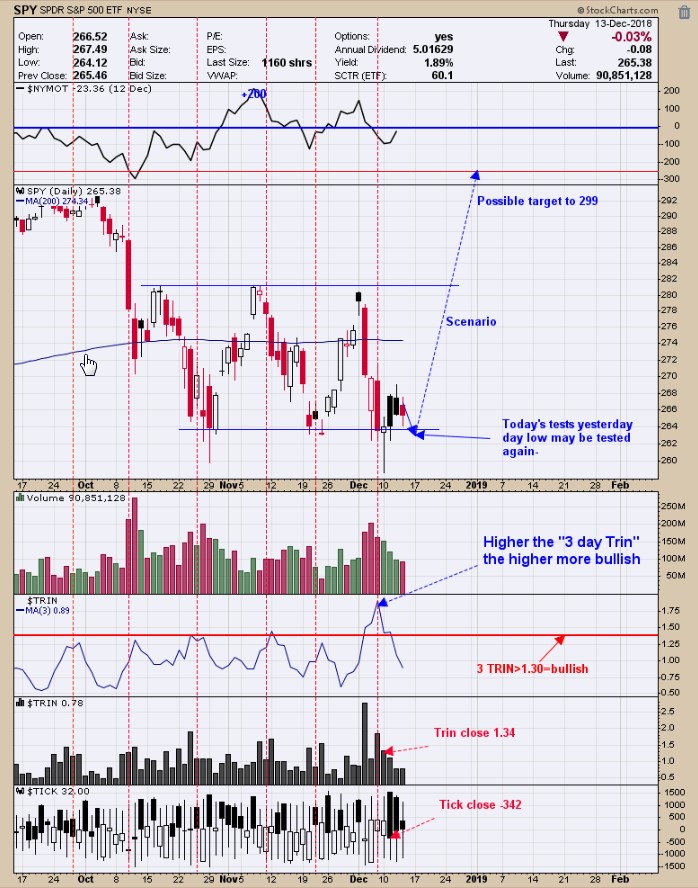
The 3-day chart shows that TRIN reached over 1.75 last Friday; the higher the reading the more bullish the trend will be. On Tuesday, the Tick closed at -342 and on Monday the Trin closed at 1.34 which is a bullish combination and shows that a panic is present and we all know that the market bottoms on panic. We have had super volatility over the last several weeks and the market has become calm. This calmness may continue going into the FOMC meeting next Tuesday and Wednesday, which may increase the fear level which would be even more bullish. The FOMC meeting announces on Wednesday could be the catalyst for the next rally. Whether the rally starts now or at the FOMC meeting, the sentiment probabilities point to a bullish trend.
From four weeks ago an analyst said: “Since 1950 the change from October low through year-end average=10.7% gain (with no losses) during midterm elections years (@theonedave). The 10.7% average from the October low would give a target near 289 on the SPY (2890 SPX).”
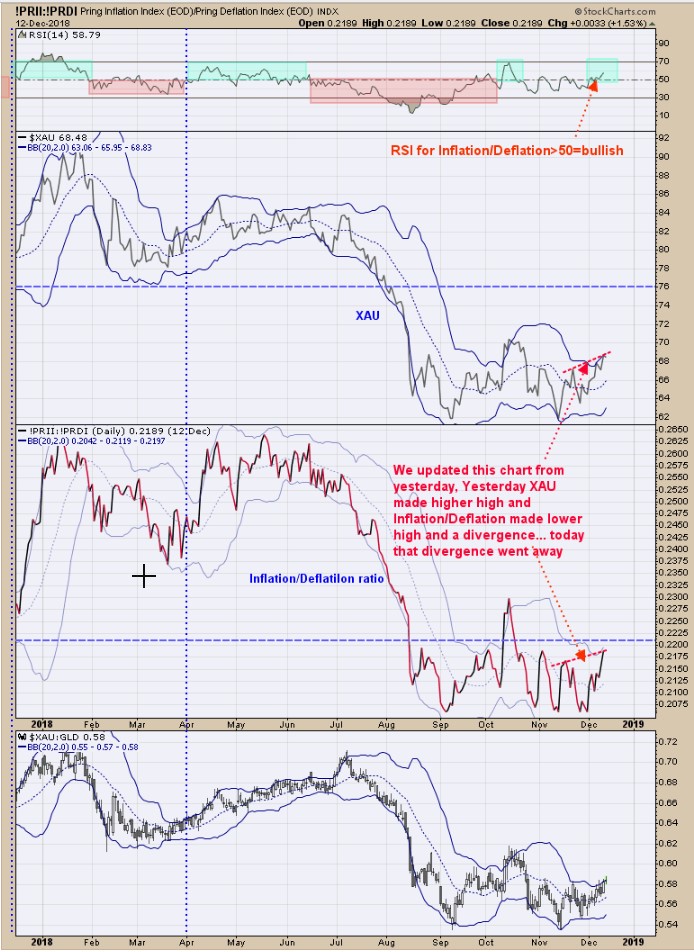
The Inflation/Deflation index moves in tandem with the XAU. When there is a divergence between the two, the Inflation/Deflation index normally gives the correct answer.
We updated this chart from yesterday. Yesterday there was a divergence where XAU made a higher high and inflation/Deflation ratio made a lower high and a bearish divergence. Today that divergence went away as both indexes made higher highs. The top window is the RSI for the Inflation/Deflation ratio and the readings above 50 are bullish. Today’s reading was 58.79. The last COT report showed that Gold commercials moved to a 58K short position and above the 50K which is in the neutral category for them.
There is a cycle low due in January or February of 2019, which would imply there will be a minor high soon. We are watching carefully what this chart does next, either a bull run is starting or a short-term top is near.
Our thinking at the moment is still a pullback first before the real Bull Run begins. We sold our long GDX position (11/27/18) at 18.88 for a .075% gain; Long GDX at 18.72 on 8/17/18. We will wait for the next bullish setup.
Disclaimer: Signals are provided as general information only and are not investment recommendations. You are responsible for your own investment decisions. Past performance does not guarantee future ...
more

