
Market Correction Perspectives
Written by LPL Financial
After an extraordinary two-year period of market calm, the major U.S. equity markets slipped into correction territory last week. A perfect storm of investor worries collided over the past six trading days, including inflation, monetary policy, and the unwinding of crowded, complex trades. The result was an unprecedented bout of market volatility, highlighted by 1,000-point swings in the Dow Jones Industrial Average and the fastest retreat ever (nine days) from a record level in the S&P 500 Index to a correction.
In light of last week’s market action, we think it is appropriate to provide investors with perspective on these developments by answering three basic questions:
- What happened?
- Where might stocks go from here?
- What actions should investors take?
We hope the answers to these questions will provide investors with valuable perspective on the market correction, help them figure out a potential path forward, and facilitate informed long-term decisions relative to diversified portfolios.
What Happened?
Equity markets slipped into a correction (defined as a 10% or more drop from a recent high) for the first time since February 2016 as volatility soared, trading volumes surged, and stock prices plunged. The initial catalyst was higher than expected wage growth in the January jobs report, which increased fears that inflation would accelerate and that the Federal Reserve (Fed) would be more aggressive in 2018. Market interest rates then headed higher, the yield on the benchmark 10-year Treasury climbing approximately 25 basis points (0.25%) in the past two weeks. These developments caused the market’s so-called fear gauge, the VIX Volatility Index, to more than double at the most stressful points last week, further accelerating selling pressures.
The potential for higher than expected interest rates had equity investors perplexed in many ways. Would higher rates slow down economic activity? Weigh on corporate profits? Pressure price-to-earnings (PE) ratios? Make bonds a more attractive alternative?
One important driver of the market sell-off was that investor sentiment had become too complacent these past two years and bullish sentiment prevailed as the major equity market indexes trudged higher to record price gains, along with the absence of volatility. This extended period of low volatility also led many institutional and individual investors down the path of crowded, complex trades, which used leverage, or borrowed money, to bet on a continuation of market peace. Once market interest rates and the VIX suddenly turned higher, these trades unwound, causing further selling pressure as traders needed to sell other holdings to raise cash to satisfy their debt obligations from their “short volatility” positions. Essentially, selling begot more selling and equity markets around the globe plunged.
Where Might Stocks Go From Here?
What hasn’t made as many headlines over the past week is that economic and profit data have been very strong, indicating that the market sell-off is detached from the fundamentals, making the correction normal and healthy. To be sure, recent readings on U.S. gross domestic product (GDP) and employment have been solid, and reports on manufacturing and services have been the highest in more than a dozen years. Consumer and small business confidence are at the highest levels of the expansion as a combination of tax cuts, government spending, and an improved lending environment appear poised to sustain growth in 2018 and 2019. In addition, fourth quarter 2017 earnings are coming in ahead of expectations, and companies are providing positive guidance, leading analysts to raise their forecasts for corporate profits in 2018.
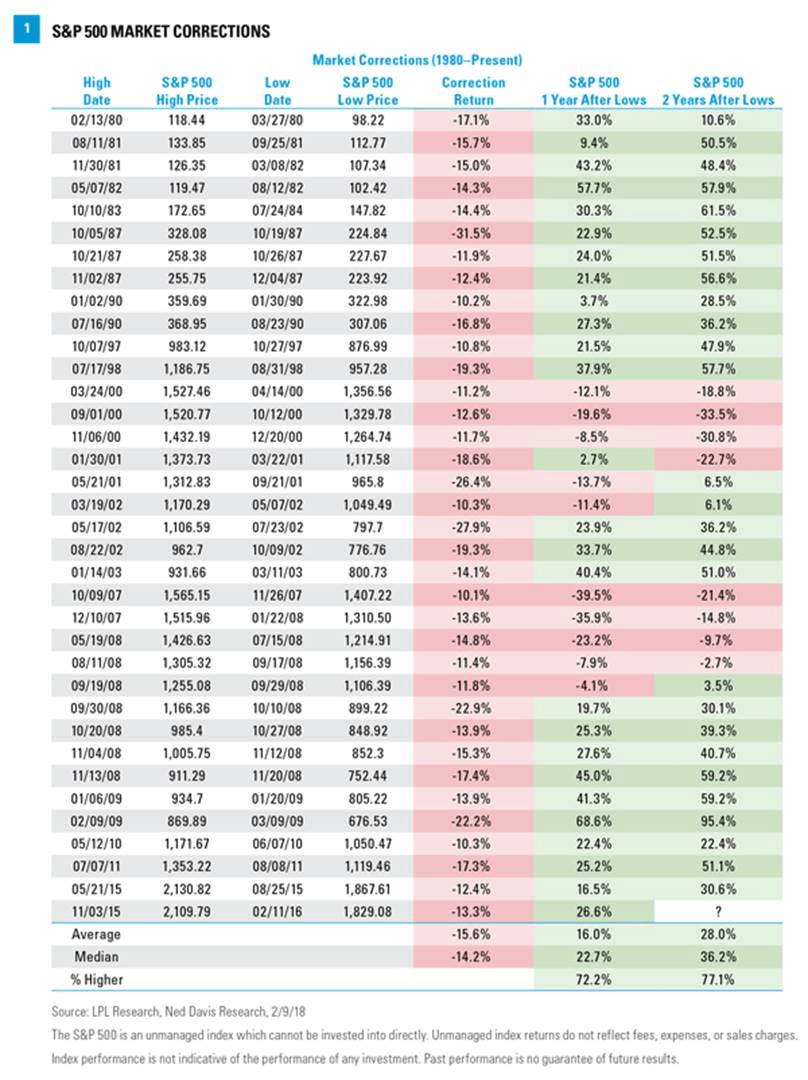
Nevertheless, the markets have corrected. Though unnerving, corrections are a normal part of long-term investing. Indeed, since 1980, we have now experienced 37 corrections, with the S&P 500 falling by an average of 15.6% from peak to trough during the last 36 occurrences. Twelve months later, however, the index made up some ground, rising an average of 16.0% from the low, and after 24 months, the S&P 500 had climbed by an average of 28.0%, reinforcing the necessity for long-term investors not to stray from their diversified strategies during periods of market turmoil [Figure 1].
(Click on image to enlarge)
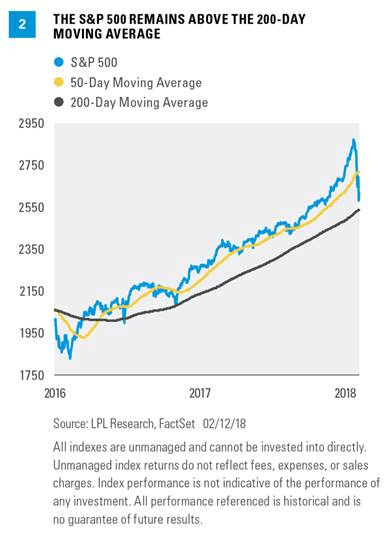
Investors should be aware that market recoveries are often a relatively long process taking place over several weeks or months, without one clear identifiable catalyst. One unique characteristic of the current environment is that the equity markets had been so strong, that even though we’ve entered a correction, the S&P 500 still remains above its 200-day moving average (MA), an important technical support level that historically has helped determine the direction of stock prices during volatile periods [Figure 2]. Frequently, the index needs to fall below this level to “wash out” the weak hands before consolidating and then trending higher. Only one of these past 36 corrections concluded with the S&P 500 above its 200-day MA.
We are preparing for the possibility over the next several days or weeks to see the index reach an average correction of about 15%, and possibly a bit more. However, considering the still solid economic backdrop, well below average levels for interest rates and inflation, strong trends for corporate profits, and the still positive technical analysis picture for the S&P 500, we suspect stocks may soon stabilize with little additional downside from current levels. Simply stated, if this correction were a baseball game, we believe we would be approaching the seventh inning stretch.
What Actions Should Investors Take?
Our first piece of advice for investors is don’t panic. Unwinding the leveraged short volatility trade is messy, which has magnified the intensity of the recent sell-off. We also believe it masks the solid fundamental backdrop, which may cause suitable investors to sell (unnecessarily) into further market weakness. Instead, we encourage investors to view the recent market correction as an opportunity to reassess portfolios and look for spots to either deploy cash or rebalance to longer-term allocation targets.
Second, we were not particularly surprised by recent market volatility given: 1) last year’s absence of volatility, 2) the market’s propensity to test a new Fed chair, and 3) historical trading patterns during midterm election years. Yet, we also have emphasized in our Outlook 2018: Return of the Business Cycle publication that the transition from monetary policy leadership to fiscal policy leadership may provide opportunities. We believe the combination of improving business fundamentals and the benefits of fiscal reform, federal spending, and reduced regulation will continue to support growth in the economy and corporate profits for at least the next year.
Third, we expect market interest rates to only nudge higher in 2018. Market dislocations occur when rates surge, like the recent move in the benchmark 10-year Treasury yield to 2.85%. Remember, the current interest rate, based on the 10-year Treasury, is still at the low end of our year-end forecast range of 2.75%–3.25%. A gradual move higher based on improved economic activity, slightly higher pricing measures, rising deficit spending, and a Fed that remains measured in the tightening cycle, remains in play, but higher yields may also attract more buyers, especially considering the yield advantage of Treasuries over other developed market debt.
Despite the equity market correction, the U.S. Treasury yield curve steepened last week, a market signal pointing toward future economic growth; and credit spreads, the interest rate difference between corporate debt and Treasuries, remained narrow, suggesting a lack of stress and a vote of confidence for future economic output.
Investors may want to consider reviewing fixed income allocations given these developments. We continue to believe bonds play an important role in portfolios, providing sources of income, liquidity, and the potential to smooth out portfolio performance during periods of equity market volatility.
Finally, we encourage investors to view the recent equity market weakness relative to the many positive fundamental equity market trends, including strong economic growth and corporate profits. Considering these positive fundamental trends, we remain favorable on the longer-term investing environment for equities. Fourth quarter earnings season has been very strong and corporate guidance for 2018 profitability is positive and upward sloping, causing consensus earnings projections to accelerate. Even before the recent equity weakness, forward-looking market PE ratios declined as earnings per share forecasts increased to levels that we believe are more attractive to long-term investors [Figure 3].
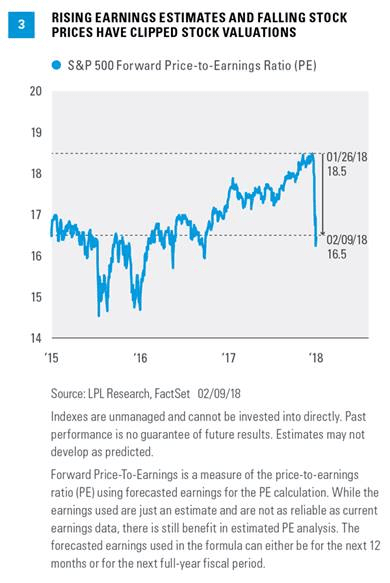
The strong upward revisions to analysts’ earnings estimates for the S&P 500 during fourth quarter earnings season, along with the drop in stock prices, have clipped more than 10% off of stock valuations in only a couple of weeks. On a forward PE basis, the S&P 500 has gone from 18.5 times to 16.5 times, according to FactSet. Though 16.5 times is still above historical averages, we believe market PE multiples must be viewed relative to interest rates and inflation, both of which remain well below their long-term trends. Given that the market PE is now 2 points cheaper, we consider current stock valuations attractive and suspect valuations may ultimately once again approach their recent peak before the end of this bull market.
Conclusion
Given the market’s steady increase, the lack of volatility, and the bullish sentiment that prevailed, we believe the correction was a logical response. Though unsettling, market corrections are typical, having now occurred 37 times over the past 38-plus years. These experiences provide a good opportunity for investors to reassess the market environment and examine allocations relative to long-term targets.
Despite this recent correction, we maintain our fair value estimate of 2,850–2,900 for the S&P 500, representing a move of approximately 10% from current levels. We continue to position portfolios toward beneficiaries of the current monetary and fiscal policy dynamics, including value, small caps, financials, industrials, and technology, along with our previous guidance favoring emerging market equities.
Special thanks to Ryan Detrick and Jeffrey Buchbinder for their contributions to this commentary.
Disclaimer: This article is NOT an investment recommendation, please see our disclaimer - Get ...
more

