
Market Breadth Improves As Investors Rotate Back To Quality
The stock market rally off the February lows initially was led by the usual combination of short-covering, oversold bottom-feeding, and speculation (on “junk"). But then market action started showing signs of improving market breadth and a rotation back into higher quality companies -- the types of companies with characteristics Sabrient typically seeks in our GARP (growth at a reasonable price) selection process. It is notable that price action for the S&P 500 was very similar during 2015 to what occurred in 2011. When it happened in 2011, the market quickly got back on track to start 2012, but this year, it took until mid-February before markets launched a concerted recovery, and it was a few weeks after that before the flight to quality began.
Economic reports continue to show mixed but mostly positive results, and yet investors are seemingly unconcerned about the Fed talking up the possibility of a June rate increase, and some market commentators suggest that investor are now embracing another rate hike as a sign of more robust economic growth. However, from my vantage point, the fed funds futures have not changed very much.
In this periodic update, I give my view of the current market environment, offer a technical analysis of the S&P 500 chart, review our weekly fundamentals-based SectorCast rankings of the ten U.S. business sectors, and then offer up some actionable ETF trading ideas.
Market overview:
Last week, technology and biotech led the market surge, with the Nasdaq gaining +3.4% for the week (the most since February), while financials gained +2.6%. Notably, Tech, Healthcare, and Financial sectors make up 50% of the S&P 500, thus serving to boost that index, as well. However, for the month of May, it was all about the Nasdaq, which rose +3.6% while the Dow Industrials gained less than +0.1% and the S&P 500 large caps gained +2% (total return basis), as did the S&P 400 mids and S&P 600 smalls. The Technology sector gained +6% for the month, while Financials gained +1.8% after a late surge. Not surprisingly given the aforementioned, Growth outperformed Value.
The Commerce Department revised its first-quarter GDP estimate up to 0.8% from 0.5%. In addition, the final reading for the University of Michigan Consumer Sentiment survey for May was a solid 94.7. Then on Tuesday, the Conference Board Consumer Confidence came in at 92.6 for May, which is decent, but the Chicago PMI report for May fell to 49.3, which is the sixth time it has registered below 50 (the dividing line between manufacturing activity expansion and contraction) during the past 12 months. Other important reports due out this week include ADP employment, PMI manufacturing, construction spending, and ISM manufacturing on Wednesday, and then Friday brings the Government Employment report and ISM services.
Home price appreciation has been strong -- albeit with help from the Federal Reserve’s asset-inflating monetary policies. Both existing and new home sales and prices in April were considerably stronger than expectations, and sales of new homes are the strongest since way back in January 2008. Moreover, the median price of a new single-family home hit a record high ($321,100) in April, while the average price of an existing single-family home is near the all-time record from June 2015.
Nevertheless, the slope of the domestic yield curve remains pretty darn flat, as global liquidity continues to seek the safety and higher returns of US Treasuries. The 10-year yield closed Tuesday at a 1.83% while the 2-year closed at 0.88%, indicating a spread of 95 bps, which remains below the 100 bps threshold of concern.
Fed funds futures are indicating only a 22.5% probability of a rate hike in June. Although it has risen significantly, it is still relatively low. Many economists give a June rate hike more like a 60% chance, but the fed funds futures show the consensus of many smart traders with money on the line, and it tends to be quite prescient. However, the probability rises to nearly 60% come July, and then 62% for at least one hike by September, and 77% probability of at least one rate hike by December (and 33% chance of two rate hikes by then).
The US dollar closed the month of May with a +3.2% gain against a basket of 16 currencies, as tracked by the WSJ Dollar Index, thus ending three consecutive months of declines. Still, for the year, the dollar is down -2.5%. Oil eclipsed the $50 mark on Tuesday as it attempts to test resistance at the October high ($50.90), but then closed the month at $49.10/bbl. Gold lost -5.8% during May. The CBOE Market Volatility Index (VIX), aka fear gauge, closed the month at 14.19, although intraday on Tuesday it briefly touched the 15 fear/complacency threshold before falling back late in the day.
Overall, markets are looking healthier and investors appear to be looking forward to stronger GDP growth and corporate earnings in the second half of the year. But looking back, there is no doubt that market conditions during the August-February timeframe confounded many smart and highly successful fundamental-driven investors. Not only did their performance suffer, but also many sparkling reputations were tarnished. Although the major cap-weighted indexes held up okay during that period, if you pull back the curtain there was very narrow market breadth -- characterized by a handful of big winners while most stocks languished, mostly due to a combination of global uncertainty and abundant global liquidity.
Likewise, Sabrient’s portfolios struggled during that timeframe. Our core stock selection approach starts with a proprietary GARP quant screen to identify a short list of candidates for further fundamental analysis. This is entirely bottom-up and numbers-driven and relies heavily on our data feed of forward estimates of earnings and revenue expectations from the Wall Street community of sell-side research analysts who closely follow these companies and their industries. Thus, when those estimates got turned on their heads beginning last summer, it severely impacted our portfolios.
For the past two years, the broad market has been stuck in a trading range. For the S&P 500, the range has been roughly 1900-2100. It has been characterized by a series of micro bear markets, so to speak, seemingly moving from one sector to the next. First, it was energy and commodities starting in late 2014, which by extension led into industrials and then financials. Next, biotech was targeted, and then semiconductors and other technology segments, including Apple (AAPL). Some of this was driven by election campaign rhetoric targeting banks and biotechs, and some was caused by China coming clean on its slowing growth, which influenced forecasts for everything from construction equipment to iPhone sales. Most recently it was consumer retail -- with the exception of Amazon.com (AMZN), which hit another all-time high on Tuesday, and a few other retail segments that avoid competing directly with Amazon, like the home improvement and one-dollar stores.
To illustrate the lack of market breadth, let’s take a look at how large caps have performed versus smalls, and how cap-weighted indexes have performed against equal-weighted. In a healthy market, equal-weighting typically outperforms as many stocks from various market segments garner investor attention, including many well-positioned small caps. However, for 2015, the cap-weighted SPDR S&P 500 Index Trust (SPY) was up +1.2% while the equal-weighted Guggenheim S&P 500 Equal Weight ETF (RSP) was down -2.7%. Moreover, the broad-based iShares Russell 2000 ETF (IWM) was down -4.5% while the Russell 2000 Equal Weight Index was down -10.7%.
Thus, the performance spread between the cap-weighted large caps and the equal-weighted small caps was about 12% during 2015. However, this entire gap formed during the second half of the year. There was no performance gap at all during the first half. It is notable that this same price action and breadth occurred during 2011, although the performance gap described above was somewhat less pronounced during the second half of 2011 (approximately 7.7% between SPY and the R2000 Equal Weight Index).
Although the 12% gap was large last year, it got even wider during the first couple of months of 2016, reaching a 16.4% spread in mid-February. Since then, the spread has swung dramatically the other way, indicating to me a significant broadening of the market, which bodes well both for active stock-picking (vs. passive indexing) and for equal weighting (vs. cap weighting). Indeed, since February 11, SPY is up +15.3% through end of May, while the RSP is up +19.0%, IWM is up +21.7%, and the Russell 2000 Equal Weight Index is up +23.6%. This all speaks to improving breadth as small caps outperform large caps and equal weighting outperforms cap weighting.
Notably, the “FANG” gang of Facebook, Amazon, Netflix, Google has been underperforming this year -- up only +1.8% YTD, and AAPL is down -5.2% YTD. Meanwhile, the S&P 500 total return is +3.5% YTD.
History tells us that markets eventually reward higher quality companies that display solid business models, balance sheets, management, products, and service, which is what Sabrient tries to identify. After all, we believe this is what investing is supposed to be all about, as opposed to short-term trading or speculation. It appears to me that we now are seeing signs of improving market breadth and a rotation back into higher quality stocks.
Oh, by the way, I am excited to attend (for the first time ever!) the 21st annual IMN Global Indexing and ETFs Conference(link is external) at the St. Regis Monarch Beach Hotel in scenic Dana Point, CA on June 26-28. IMN.org has provided me with a discount code to share with any of my readers who might want to attend: SD10. I hope to see you there!
SPY chart review:
The SPY closed Tuesday (and the month of May) at 209.84 and is back above all its major moving averages. It is testing resistance at 210 (corresponding with S&P 500 index at 2100), and could soon challenge its all-time high from last May 2015 at 213.34. After a strong rally from the mid-February edge-of-the-cliff reversal, SPY topped out in mid-April right around this same 210 level and then fell into a sideways channel, even forming a minor head-and-shoulders top with a downside target of 197 (if the pattern confirmed). However, the neckline of the head-and-shoulders formation (around 203.5) held strong, and the bearish pattern never confirmed, instead serving as a launching pad for further upside. Notably, current price action has a lot of similarities to what we saw around the first of December, which has led many chartists to shy away from being too bullish. I have shown several lines of support and resistance that could come into play in this highly congested chart, including a number of gaps during the last couple of weeks that will act as a magnet. I still believe that we are most likely in store for more sideways action during the summer, whether it tops out right here or perhaps a little higher, without setting a new all-time high. However, I also believe we will see a new all-time high before year-end. Oscillators RSI and Slow Stochastic are looking toppy and ready to roll over, although MACD looks more neutral.
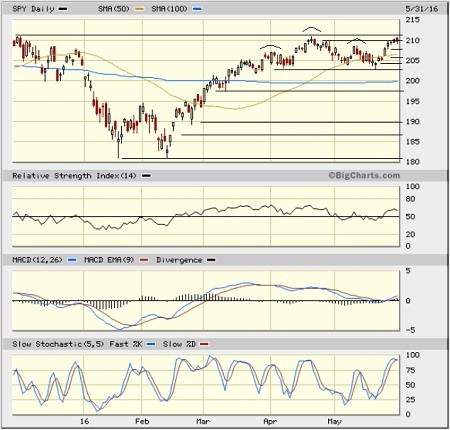
Other key indexes have really perked up after looking quite bearish a couple of weeks ago. The Nasdaq, Russell 2000, and Dow Jones Transports have each recovered their 200-day simple moving averages after finding support at their 100-day SMAs. This is all quite encouraging for equity bulls.
Latest sector rankings:
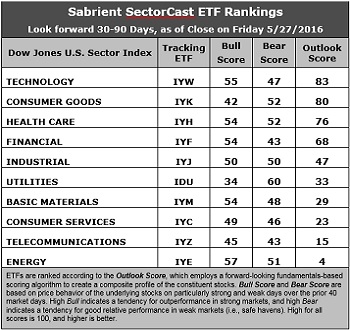
Relative sector rankings are based on our proprietary SectorCast model, which builds a composite profile of each equity ETF based on bottom-up aggregate scoring of the constituent stocks. The Outlook Score employs a forward-looking, fundamentals-based multifactor algorithm considering forward valuation, historical and projected earnings growth, the dynamics of Wall Street analysts’ consensus earnings estimates and recent revisions (up or down), quality and sustainability of reported earnings (forensic accounting), and various return ratios. It helps us predict relative performance over the next 1-3 months.
In addition, SectorCast computes a Bull Score and Bear Score for each ETF based on recent price behavior of the constituent stocks on particularly strong and weak market days. High Bull score indicates that stocks within the ETF recently have tended toward relative outperformance when the market is strong, while a high Bear score indicates that stocks within the ETF have tended to hold up relatively well (i.e., safe havens) when the market is weak.
Outlook score is forward-looking while Bull and Bear are backward-looking. As a group, these three scores can be helpful for positioning a portfolio for a given set of anticipated market conditions. Of course, each ETF holds a unique portfolio of stocks and position weights, so the sectors represented will score differently depending upon which set of ETFs is used. We use the iShares that represent the ten major U.S. business sectors: Financial (IYF), Technology (IYW), Industrial (IYJ), Healthcare (IYH), Consumer Goods (IYK), Consumer Services (IYC), Energy (IYE), Basic Materials (IYM), Telecommunications (IYZ), and Utilities (IDU). Whereas the Select Sector SPDRs only contain stocks from the S&P 500, I prefer the iShares for their larger universe and broader diversity. Fidelity also offers a group of sector ETFs with an even larger number of constituents in each.
Here are some of my observations on this week’s scores:
1. Technology takes the top spot with a robust Outlook score of 83, with a strong forward long-term growth rate (14%), solid return ratios, and a sudden improvement in its relative Wall Street analyst sentiment (net positive revisions to earnings estimates). However, its forward P/E has risen from 15.2x to 16.3x in just the past couple of weeks, and it appears that Wall Street has been quieting down on its adjustments to earnings estimates, so we will need to see how things develop. Consumer Goods (Staples/Noncyclical) takes second with an 80; however, the sector’s forward valuation remains pricey at about 18x while its forward long-term growth rate is a relatively low 9.6%. Healthcare falls to third at 76 with generally good factor scores across the board (but none that particularly stand out). Technology takes third again with a 72. It boasts the highest forward long-term growth rate, which is now 13.6%, and its forward P/E has fallen to an attractive 15.2x. Financial has risen to fourth and still displays the lowest aggregate forward P/E (although it has risen to 15x). Rounding out the top of the rankings are Industrial, Utilities, and Basic Materials.
2. Energy remains at the bottom with an Outlook score of 4 as the sector scores among the worst in several factors of the GARP model, including the highest forward P/E at 26.5x. However, its forward long-term growth rate has continued to strengthen (as oil price continues to rise) and now stands at 15.3% -- which is the highest of all sectors and a far cry from the negative numbers it displayed for so long. Telecom takes the other spot in the bottom two with an Outlook score of 15.
3. Looking at the Bull scores, Energy has the top score of 57 as it displays relative strength on strong market days, while Utilities is the lowest at 34. The top-bottom spread is 23 points, which reflects quite low sector correlations on strong market days, which can be good for stock picking. It is desirable in a healthy market to see low correlations reflected in a top-bottom spread of at least 20 points, which indicates that investors have clear preferences in the stocks they want to hold (rather than broad risk-on behavior).
4. Looking at the Bear scores, Utilities (as usual) displays the top score of 60, which means that stocks within this sector have been the preferred safe havens on weak market days. Financial and Telcom ($!) score the lowest at 43, as investors flee during market weakness. The top-bottom spread is 17 points, which reflects moderately low sector correlations on weak market days, which can be good for stock picking. Ideally, certain sectors will hold up relatively well while others are selling off (rather than broad risk-off behavior), so it is desirable in a healthy market to see low correlations reflected in a top-bottom spread of at least 20 points.
5. Technology displays the best all-around combination of Outlook/Bull/Bear scores, followed closely by Healthcare, while Telecom is the worst. However, looking at just the Bull/Bear combination, Energy is the best, followed by Healthcare, indicating superior relative performance (on average) in extreme market conditions (whether bullish or bearish), while Telecom is the worst.
6. This week’s fundamentals-based Outlook rankings still have a somewhat bullish tilt, in my opinion, given the scoring strength in Technology, Healthcare, Financial, Industrial, and Basic Materials, and the relative weakness of Utilities and Telecom. Keep in mind, the Outlook Rank does not include timing, momentum, or relative strength factors, but rather is a reflection of the fundamental expectations for individual stocks aggregated by sector.
ETF Trading Ideas:
Our Sector Rotation model, which appropriately weights Outlook, Bull, and Bear scores in accordance with the overall market’s prevailing trend (bullish, neutral, or defensive), now reflects a bullish bias and suggests holding Technology, Healthcare, and Financial, in that order. (Note: In this model, we consider the bias to be bullish from a rules-based trend-following standpoint when SPY is above both its 50-day and 200-day simple moving averages.)
Besides iShares’ IYW, IYH, and IYF, other highly-ranked ETFs in our SectorCast model from the Technology, Healthcare, and Financial sectors include VanEck Vectors Semiconductor ETF (SMH), Loncar Cancer Immunotherapy ETF (CNCR), and PowerShares KBW Regional Banking Portfolio (KBWR).
Others scoring near the top of the rankings with a strong combination of Outlook, Bull, and Bear Scores include Guggenheim Invest Shipping ETF (SEA), iShares US Home Construction ETF (ITB), and PowerShares KBW High Dividend Yield Financial Portfolio (KBWD) -- with an 8.6% yield.
If you prefer a neutral bias, the Sector Rotation model suggests holding Technology, Consumer Goods (Staples/Noncyclical), and Healthcare, in that order. On the other hand, if you prefer a defensive stance on the market, the model suggests holding Utilities, Consumer Goods (Staples/Noncyclical), and Healthcare, in that order.
Disclosure: Author has no positions in stocks or ETFs mentioned.
Disclaimer: This newsletter is published solely for informational purposes and is not to be construed as advice ...
more

