
Market At High Tide
Market Overview
Just as the ocean ebbs and flows with rhythmic regularity, so does the market. While the analogy is not exact, this will be apparent to anyone who looks at a long-term chart of the stock market. Between the time the tide comes in and goes out, there is a short interval when the ocean is essentially motionless. This is often the case at market tops as well. For the latter, this is the time when stock changes from strong hands to weak hands, a period also known as a distribution phase.
I believe that this is where we are, currently. There is still enough buying to move the market a little higher, but the momentum deceleration is obvious, and negative divergence has appeared on chart oscillators. When it shows up at the weekly, and even at the monthly level, it is time to pay attention. Especially when projection targets have been met. This is what I have been saying for the past couple of weeks. SPX 2300 (ca) is the projection level derived from the re-accumulation pattern that formed at the 1810 level, and which may also relate to the 2009 low-- but that is much less clear.
As stated earlier, P&F projections are approximations, and the fact that the index reached 2319 last week, should not invalidate the projection, especially when serious negative divergence is showing on all time frames. It’s not a sell signal yet, only a warning, and one which should be heeded until the market tells us it’s a false alarm. As one analyst put it, last week: “The market almost always pushes you to the limit, and this potential ending diagonal is now being pushed to its limit. (Avi Guilburt – ElliottWaveTrader)
Analysis (This chart and others below, are courtesy of QCharts.com.)
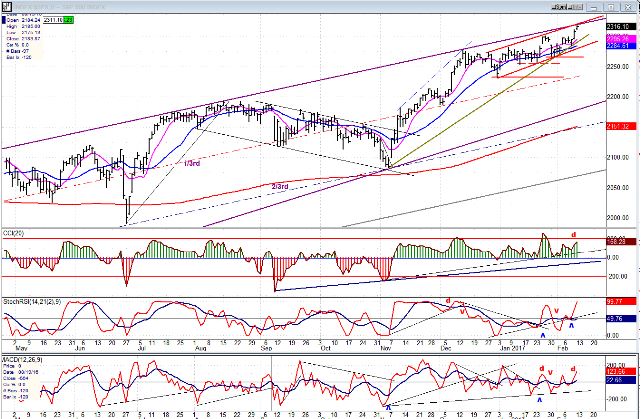
Daily chart
SPX has once again reached the upper trend line which has stopped its advance several times before. Will it go through this time? It’s not likely, although it has formed a recent formation which projects a few points higher. Should it do that and retrace immediately, it would create a very bearish market pattern. Since it is ostensibly making an ending diagonal, the ones that push through the top and retrace immediately – a form of climactic selling – usually have immediate and severe declines which normally retrace all the way to the starting point of the diagonal. On the other hand, should we have a significant extension of the rally, the entire market action will have to be re-evaluated. This is not what I see (as I pointed out in the Market Overview), but until an actual sell signal occurs, all I can say is that this is what the odds favor and let the market speak for itself.
I mentioned earlier that negative divergence appeared in two of the three oscillators at the daily level: the CCI, and the A/D MACD. The SRSI, which is very volatile, has moved back to the top of its range. We should get a sell signal if all three quickly turn down again.
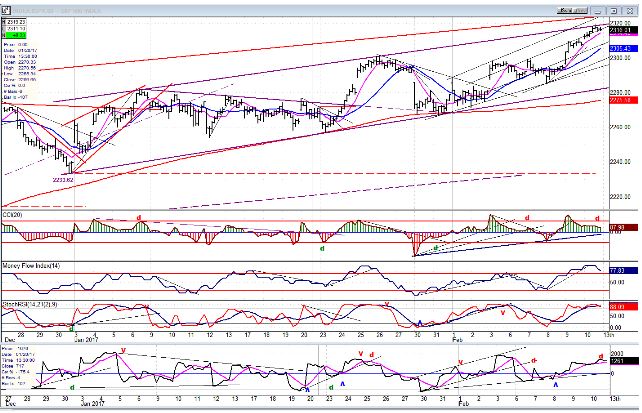
Hourly chart
On the 60m chart, we can see that SPX has moved not only to the top of the longer trend line which connects daily highs since April of last year, but also to the one connecting the hourly peaks of the index since January 2017 and, if it rises another point or two, it will meet the very short-term trend line drawn across the tops of the hourly highs made from late January.
It’s also interesting to note that Friday’s high is the third peak, of the third peak, of the third peak! Because a third peak tends to produce a reversal of sorts, this sequence could be the end of the line for the uptrend which started at 1810.
Note that the upper momentum oscillator is not only showing negative divergence, but it has also begun to turn down from its diverging high. The A/D (bottom) also shows divergence and it, as well as the other two oscillators, have also already turned down; as did the price, in the last couple hours of trading on Friday. Does that mean that we open lower on Monday morning?
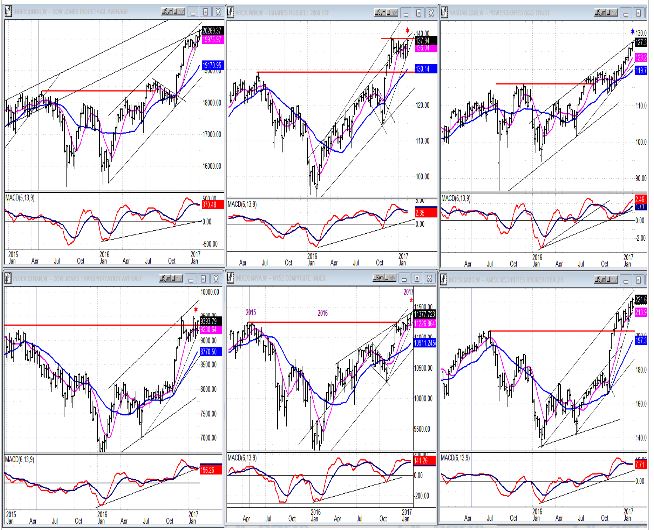
An overview of some important indexes (Weekly charts)
The recent rally has not affected all the indexes shown below, equally. After lagging, the QQQ (top right) is now leading others on the upside. By contrast, IWM (top center) and TRAN (bottom left), failed to make new highs. Finally, the NYA (bottom center) and the TRAN continue to be the weakest on a long-term basis. Both have only barely exceeded their 2015 highs.
While the overall impression is that the market is ready to correct, it remains only an opinion until clearer evidence of a reversal is provided by these indexes.
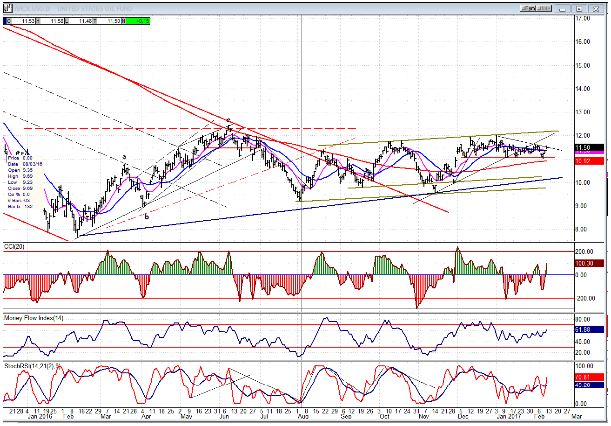
UUP (dollar ETF)
UUP has found a low and bounced, reaching a .382 retracement from its 7-year high. This could be all we get for now. More consolidation may be required before there is another attempt at reaching the higher counts provided by the three-year base that was created from 2011 to 2014, as well by the confirming re-accumulation phase that formed last year. Not until UUP has broken below 24 can we declare these counts invalid.
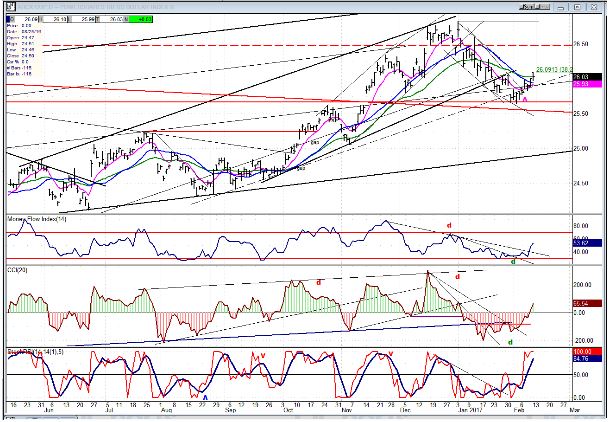
GDX (Gold Miners ETF)
GDX appears to be approaching a short-term top in the 26.00-26.50 vicinity, which could materialize over the next few days and could bring about a correction into the end of the month. After that, the index should be able to continue its uptrend toward 30 where another short-term top is likely to occur.
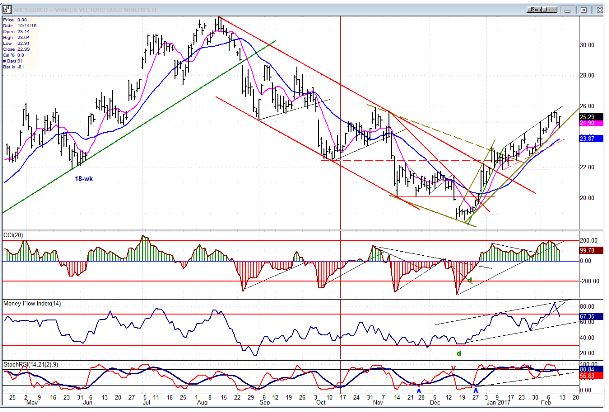
Note: GDX is now updated for subscribers throughout the day, along with SPX.
USO (U.S. Oil Fund)
USO may have lost its opportunity for a break-out above the June high and might have to be content to simply retest that level over the short term.
Summary:
After Monday’s sharp drop, SPX held at an important short-term support level and rallied after the jobs report came out on Friday. This move is essentially a test of the high, but it could expand into more distribution which could even see new highs before a reversal occurs.
As you can see from last week’s summary (above), surpassing the 2300 level did not come as a surprise. Looking at the index from several perspectives, it seems to be stretched to the limit and, while another few points may be added to Friday’s high, a reversal looks imminent.
Disclosure: Market Turning Points is an uncommonly dependable, reasonably priced service providing intra-day market updates, a daily Market Summary, and ...
more


Thanks for sharing