
March 2015 List Of Dividend Aristocrats
The Dividend Aristocrats Index is comprised of 53 stocks that have paid dividends for 25+ consecutive years. In addition to the exclusive dividend history requirement, Dividend Aristocrats must also be members of the S&P 500 Index and meet certain size and liquidity requirements. The Dividend Aristocrats Index has outperformed the market by a wide margin over the last decade, is the image below shows.

Source: S&P Dividend Aristocrats Fact Sheet
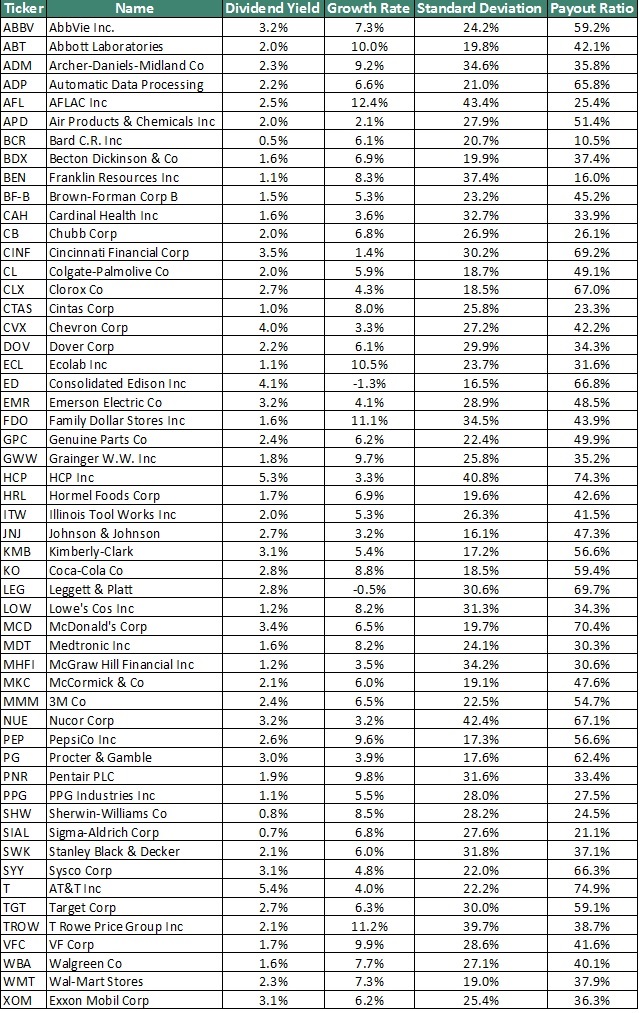
List of All 53 Dividend Aristocrats
The spreadsheet (or picture) below lists all 53 Dividend Aristocrats for March of 2015. You can sort by dividend yield, standard deviation, growth rate, or payout ratio.
March 2015 Dividend Aristocrats List – Excel Download
March 2015 Dividend Aristocrats List – Picture Download
Explanation of Financial Metrics
The four financial metrics included in the spreadsheets are the same metrics used in the buy rules from The 8 Rules of Dividend Investing, and in the Sure Dividend Newsletter. A brief explanation of each metric is below. All data is from the market close 2-27-15.
Dividend Yield
Dividend yield is calculated as 4 x most recent dividend / current price. This is the standard calculation for dividend yield and shows what percentage of dividend income you can expect on your investment in the first year (assuming no dividend increases or reductions).
Standard Deviation
Standard deviation in the spreadsheet above is calculated over a stock’s 10 year price history (when available). Long-term price histories are used to reduce the effects of unusually high or low volatility in the recent past. Interestingly, stocks with low price standard deviations have historicallyoutperformed the market. Better price returns have (obviously) come with lower ‘risk’ as defined by academics due to lower stock price standard deviation. I don’t believe standard deviation to be a true measure of risk, but it is a good proxy for measuring real risk. It has worked to improve returns historically; the historical record should not be ignored.
Growth Rate
The growth rate used in the spreadsheet above uses 10 years of data (when available). Growth rate is calculated as the lower of 10 year revenue per share growth or 10 year dividend per share growth. For financial sector stocks, 10 year book value per share growth is often used in place of revenue per share growth. Using long-term growth paints a clearer picture of a company’s real underlying business growth as it removes the random noise that comes with year-over-year growth rates. Taking the lower of revenue or dividend growth prevents companies that have unsustainable increased their dividend faster than underlying business growth or that have grown revenue without increasing dividends substantially to show a high growth growth rate that is unwarranted.
Payout Ratio
The payout ratio is calculated as last dividend payment x 4 / trailing-twelve-month earnings per share. Adjusted earnings per share are used when applicable instead of GAAP earnings per share to minimize the effects of short-term or one-time events on the payout ratio.
Final Thoughts
The March 2015 Dividend Aristocrats list is a quick and easy way to generate investment ideas for dividend growth investors. The Dividend Aristocrats Index is comprised of high quality businesses with long histories of rewarding shareholders with rising dividends. Many of the stocks in the Dividend Aristocrats Index are ‘household names'; companies or stocks that are known by many people. Some examples of these well-known blue chip Dividend Aristocrats include:
Disclosure: None.


