
Macro View: U S Bond Ready To Enter Melt Up Phase?
“All this QE and money printing is soon going to crash bonds”
“The 30 year bond bull market has reached it end and is about to implode”,
“US Governments are the ultimate return free risk investment”.
You have heard all of these statements and pleas to avoid the bond market, as its a train wreck waiting to happen. I sympathize with these arguments, but the charts don’t support this view. The opposite outcome is what the charts indicate. An analysis of the chart shows we are at the cusp of the final blow off leg up in the US government bond bull. This bull is 35 years running, but its got further to go and the next phase should knock your socks off.
Let’s review the chart of the 30 year US Bond and look at what it is saying to us.
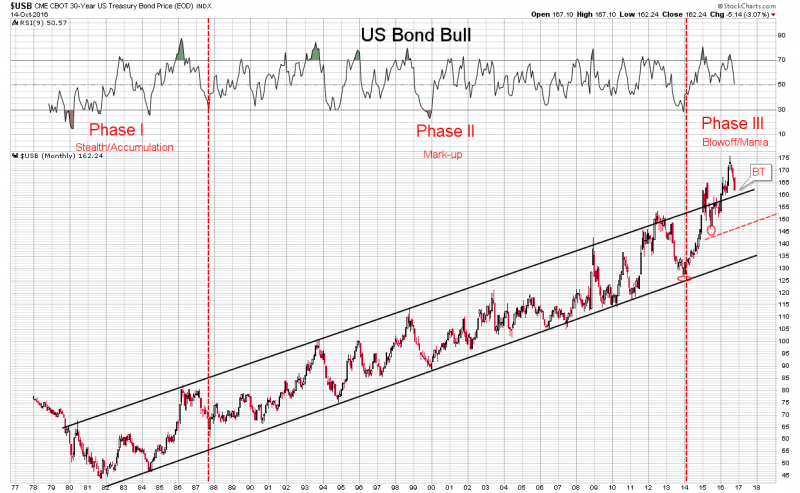
Here we see how the USB has been locked in a 35-year upward channel. Recently, however, it has broken out of the channel on the upside. This is hugely significant. Observe that in early 2014 price bottomed above its historical channel support line. That was the first clue that there was unique strength in this bull and something was about to change. Then in January 2015 it broke the upper boundary, but within 4 months it pulled back inside the channel. That’s called a false breakout (FBO) and is normal for the first penetration of a resistance level. It then made a new bottom slightly above the red dashed halfway channel line. This is a very bullish sign and was another clue as to what was to come. It then powered up through upper resistance and broke the channel to the upside in early 2016. It is now coming back down in an apparent backtest (BT) of the breakout support level. All very normal to technical rules.
Bull Market Phases
I have written extensively on the three phases of a bull and a bear market. I have marked these three phase lines on the chart. In Phase I, few believed we could possibly be in a bull market and no one noticed that’s why its called the stealth phase. Phase II, the markup phase, is the longest phase and it is the time that the retail buyer and institutions come into the market over time as they recognize it is a bull market. What comes next is Phase III, the mania or blow off phase. Think Internet stocks circa 1998-2000. The chart shows bonds now setting up for a parabolic move. This move actually started in the beginning of 2014. Once we complete the current backtest of the upper trend channel we should be off and running in the final crazy bond market blow off. No telling how long it could last, but its not out of the question for the 30-year bond rate to literally go to virtually zero!
So could this be what lies ahead in the long US Bond? If so what are the implications for commodities and gold? Stay Tuned.
Disclosure: None.


