
Macro Markets Risk Index: US Trend Remains Modestly Positive
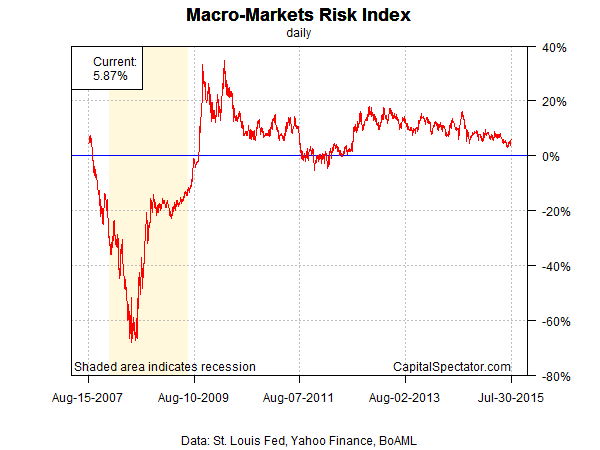
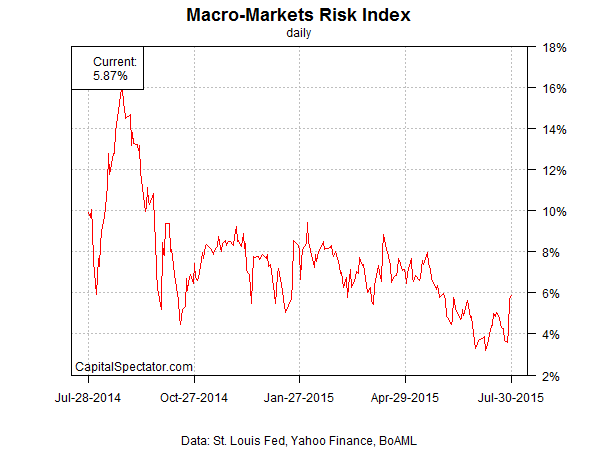
US economic momentum continues to print at a modestly positive level through the end of July, based on a markets-based estimate of macro conditions. The Macro-Markets Risk Index (MMRI) closed at +5.9% yesterday (July 30). The current level is in the lower range for the past year, although MMRI remains comfortably above zero, which implies that business-cycle risk remains relatively low. A decline below 0% in MMRI would indicate that recession risk is elevated while readings above 0% imply that the economy will expand in the near-term future. Analyzing market-price data in the financial and commodities markets with a probit model also suggests that macro risk is low.
Let’s take a closer look at the numbers, starting with MMRI, which represents a subset of the Economic Trend & Momentum indices (ETI and EMI), a pair of benchmarks that track the economy’s broad trend for signs of major turning points in the business cycle via a diversified set of indicators. (For details about ETI and EMI, see my book on monitoring the business cycle.) Analyzing the market-price components separately offers a real-time approximation of macro conditions, according to the “wisdom of the crowd.” Why look to the financial and commodity markets for insight into the economic trend? Timely signals. Conventional economic reports are published with a time lag. MMRI is intended for use as a supplement for developing real-time perspective until a complete data set is published for updating the monthly economic profile.
MMRI measures the daily median change of four indicators based on the following calculations;
• US stocks (S&P 500), 250-trading day % change
• Credit spread (BofA ML US High Yield Master II Option-Adjusted Spread), inverted 250-trading day % change
• Treasury yield curve (10-yr Treasury yield less 3-month T-bill yield)
• Oil prices (iPath S&P GSCI Crude Oil Total Return Index ETN (OIL)), inverted 250-trading day % change
Here’s how MMRI compares on a daily basis since August 2007:
The next chart shows the daily values for MMRI over the last 12 months:
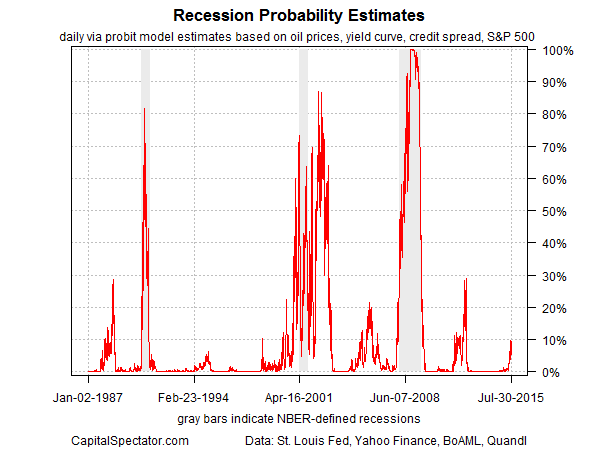
For another real-time approximation of recession risk, let’s analyze market prices through the prism of a probit model. The current estimate also points to continued growth. The probability that an NBER-defined recession has started for the US is quite low at present, around 5%, as of July 30. This estimate is based on a probit model that crunches the numbers on four data sets: the US stock market (S&P 500); the Treasury yield curve (10-year yield less the 3-month T-bill yield); the credit spread (BAA-rated bond yield less AAA yield); and spot crude oil prices (based on the US benchmark, West Texas Intermediate). For details, see this summary.
Disclosure: None.
Note: ETI is a diffusion index (i.e., an index that tracks the proportion of components with positive values) ...
more

