
Looking For Evidence Of A Bottom In The Housing Sector Index
I have written numerous articles about the big drop in U.S. housing sector indexes. The charts below show the Housing Sector Index (HGX). Currently it is down 24.9% YTD and 29% from its January high.
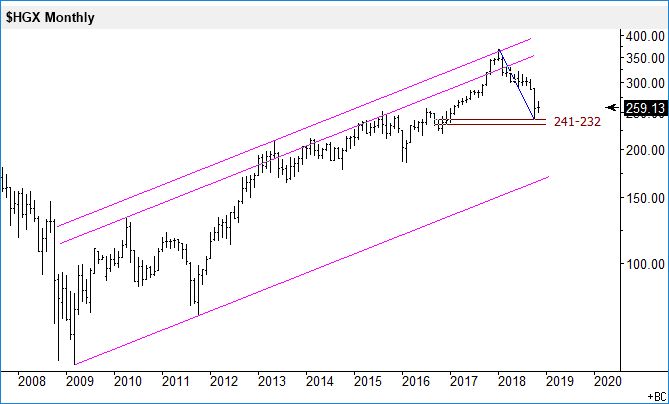
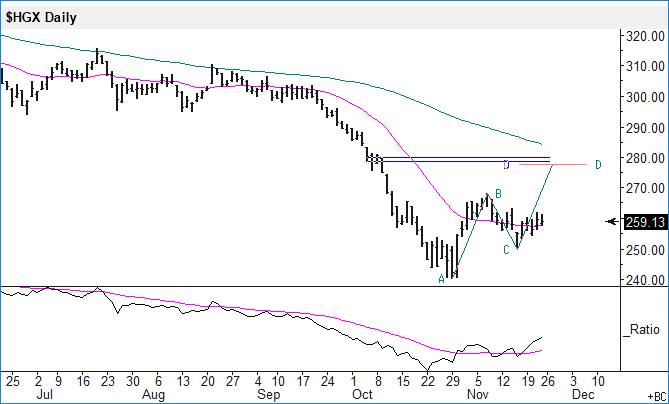
On the monthly, I have drawn in a channel and have marked an area between 241 and 232 as a potential support for the index, which is close to the middle of the channel. If the 232 level does not hold, then I expect a move lower to at least 200. Looking at the daily, the index is currently on an upswing with a potential AB=CD up pattern in play if it can push above 268. A push below 256 negates the AB=CD up pattern.
As of late, the Housing Sector index has been doing better than the S&P 500 index which is positive. I am now trying to find some evidence on the daily that price has found at least temporary bottom close to 241, but keep in mind the trend is still to the downside on that time frame.
Disclosure: The analysis provided here is usually part of the analysis the author uses when he is designing and managing his investment portfolios.
Disclaimer: The analysis presented ...
more

