
Longer-Term Weakness Ahead For Equities?
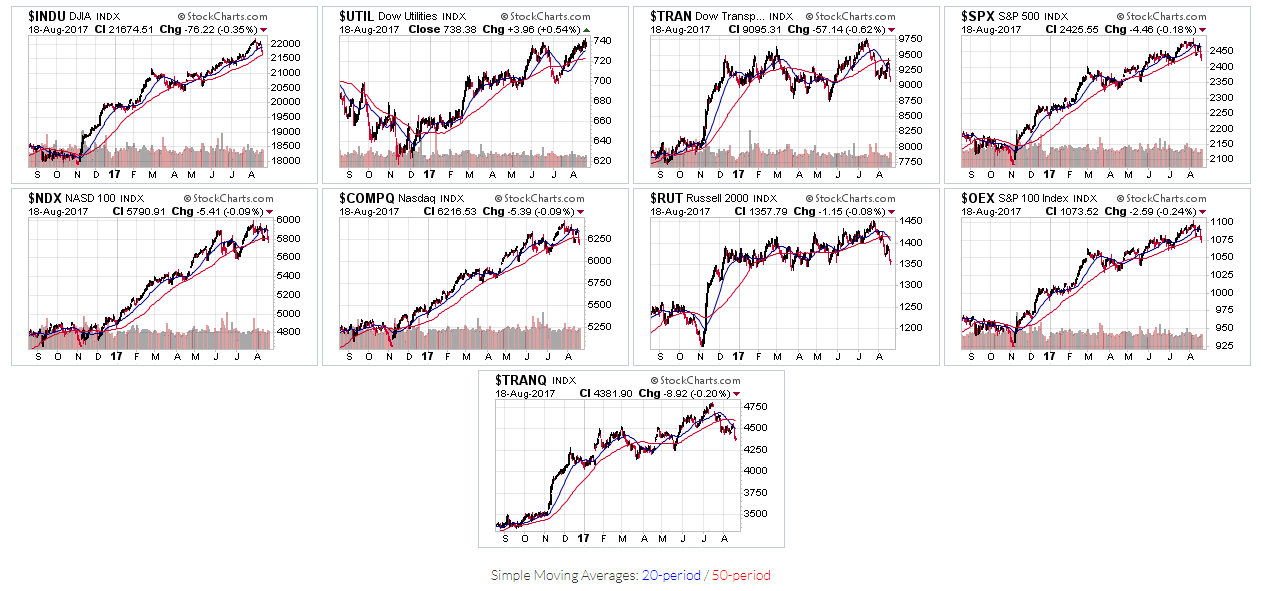
Most Major U.S. Indices (with the exception of the Dow 30 and Dow Utilities) are now below their 50-day MA, as shown on the following Daily chart grid.
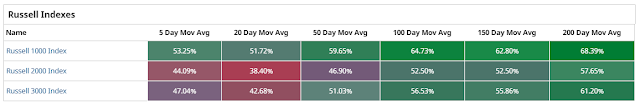
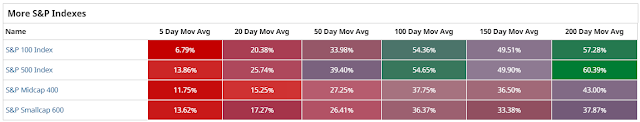
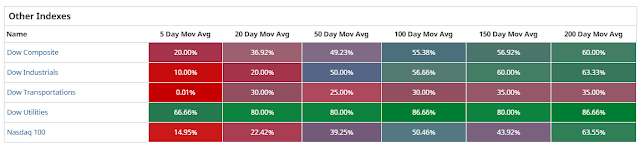
The following tables (Source: www.barchart.com) depict where the percentages of stocks in those indices were trading above a variety of moving averages two weeks ago.


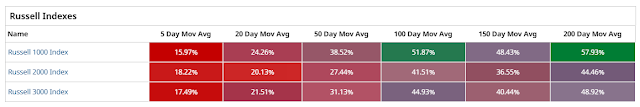
The next set of tables depict where their percentages are as of Friday's close.
You can see the dramatic shift from green to red, not only on the 50-day MA, but also the erosion beginning on the 100, 150 and 200-day MAs.
Even if we did see a "short-term Jackson Hole bounce" into next week, as I described here, it may be that, in the medium-to-longer term, the next overall prognosis for equities is further weakness ahead.
So, it may be prudent to track these percentages over the weeks to come, along with the SPX:VIX ratio mentioned in my post, to measure any further erosion and the velocity of such erosion.
It could be that we may not see any kind of meaningful and sustained buying enter the markets until most stocks are at, or below, the 200 MA.
Disclaimer: All the information contained within my posts are my opinions only and none of it may be construed as financial or trading advice... please read my full Disclaimer more


