
Long-Term Uptrend Remains Intact – Weekly Market Outlook
While Friday wasn't a particularly great day for stocks, the week itself was a winner on the heels a Goldilocks assessment from Janet Yellen and her cohorts at the Federal Reserve. While the economy isn't yet strong enough to end the bond-buying program cold turkey, it's also not weak enough that the Fed doesn't see the end of low interest rates somewhere on the horizon. The "just right" situation of not-too-hot and not-too-cold means Yellen is going to be proactively stimulative…. which has been the lifeblood for stocks for a long while now, and will continue to be for at least several more months.
On the other hand, while the long-term, economic-based undertow may be bullish, a couple of short-term red flags began waving again on Friday; a small pullback still may be in the cards.
We'll weigh the odds after running down last week's key economic numbers (and previewing this week's).
Economic Data
First and foremost, though there's no chart of it, the Federal Reserve essentially said it plans to maintain the status quo in terms of quantitative easing. That is, Janet Yellen and the rest of the Fed's governors see enough economic growth in place to continue tapering its bond-buyback program, but doesn't see growth so strong there' a need to raise the Fed's foundational interest rate from 0.25%. At the current pace, the bond-buying will end altogether in October, and though Yellen has been a little cryptic about the term "considerable time" when discussing how much longer it could be until she's forced to raise rates, most experts believe it won't happen until sometime between March and July (and some are even saying the dovish Yellen will wait until after July in 2015).
That wasn't the only thing going on last week in terms of important economic data. For instance, we heard August's industrial production and capacity utilization figures on Monday of last week. They weren't great. They weren't bad, mind you, and it's too soon to ring the alarm bells. But, industrial production fell 0.1% last month, and capacity utilization slumped from 79.1% to 78.8%. One month does not make a trend, but new trends start with that first small step.
Industrial Productivity & Capacity Utilization Chart
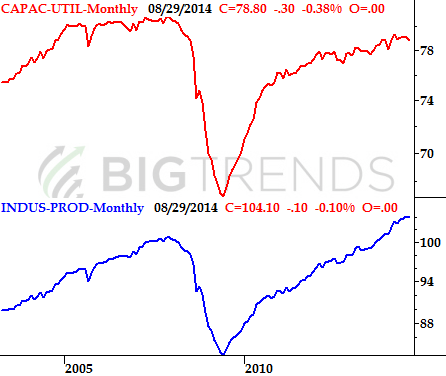
Source: Federal Reserve
At least part of the reason Janet Yellen remains so comfortable keeping interest rates at unusual lows is, there's still no worry of rampant inflation. The annualized consumer inflation rate fell for a fourth straight month in August, to 1.7%. Producer inflation has also remained tepid.
Inflation Trends Chart
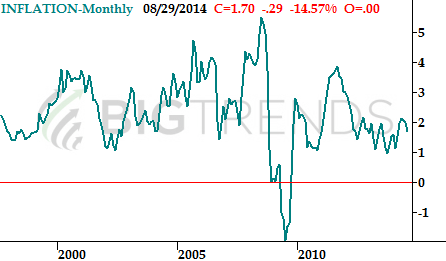
Source: Bureau of Labor Statistics
Finally, last week we kicked off a string of important real estate and construction data, beginning with housing starts and building permits on Thursday. They weren't awful, but they sure weren't great. Starts fell from a pace of 1.117 million to 956,000. Permits slumped from a pace of 1.057 million to 998,000. Both figures fell short of expectations too.
Real Estate Trends Chart
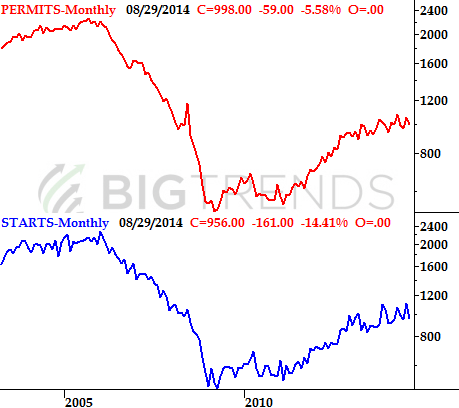
Source: Census Bureau
Clearly we've got a lot more real estate data to consider, most of which will be unveiled this week. And, there's a strong likelihood that at least some of this slow-down can be the result of builders wrapping up projects for the year before bad weather becomes a burden.
Everything else is on the following table.
Economic Calendar
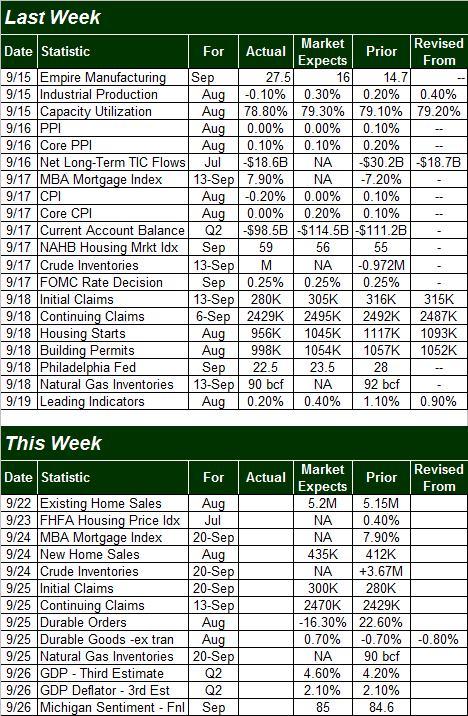
Source: Briefing.com
The coming week is a light one, obviously, though an important one for real estate and construction. In fact, most of the data we're getting is hard-hitting stuff even if a great deal of it – like Q2's GDP and the Michigan Sentiment reading – have already been previewed and aren't apt to move much (if any) from prior levels.
Stock Market Index Analysis
Though the market – via the S&P 500 and the Dow – entered breakout territory last week, Friday's action suggests the market may not actually be ready to rally.
The daily chart of the S&P 500 tells part of the tale. While the high of 2019.26 was a record-breaker, the index clearly wasn't able to hang onto that gain, pulling back to a close of 2010.40. One could still make the argument that the index hasn't made a decisive break out of its recent trading, although it's admittedly working on breaking the upper edge of that range.
S&P 500 & VIX – Daily Chart
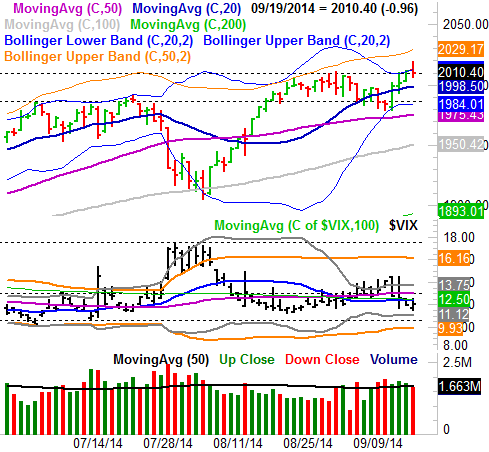
All charts created with TradeStation
Maybe Friday's retreat was just a case of some traders locking in their gains before a weekend, which just happened to impact the market in an inopportune way at the exact wrong time. Or, maybe the bears were just waiting for the masses to become convinced stocks were back in breakout mode before up-ending the rally. It wouldn't be the first time it's happened.
Now, had the S&P 500 been the only index to suspiciously stumble on Friday, it would be much easier to be bullish. The NASDAQ Composite COMP QQQ, however, waved an even more alarming red flag. As the chart of the composite illustrates below, all it took to send the NASDAQ backwards on Friday was another bump into the ceiling at 4611, right where it topped in early September.
NASDAQ Composite & VXN Daily Chart
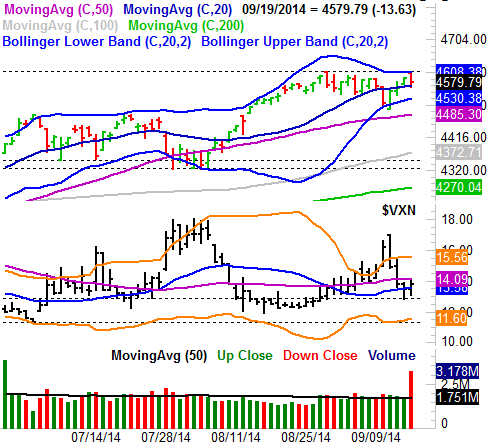
Thing is, that's almost the extent of the bearish argument. The VXN and the VIX are also low and feeling their way around for a move higher now, but aside from those facts, the bulls still technically have the edge (not to mention more momentum). The NASDAQ Composite is finding support at its 20-day moving average line, and the S&P 500 is still above all of its key moving average lines. It's also worth noting the BigTrends TrendScore is in bullish mode at 91.6, and has been giving a bullish reading for quite some time.
We're going to trust the TrendScore and the bigger-picture momentum here, but we're also going to acknowledge the bears have an opportunity this week to capitalize on Friday's weakness. The S&P 500 would need to break under 1985 and the NASDAQ would need to break under 4485 to fully flip the switch to bearishness. But, Friday's bar is what the beginning of such a move would look like.
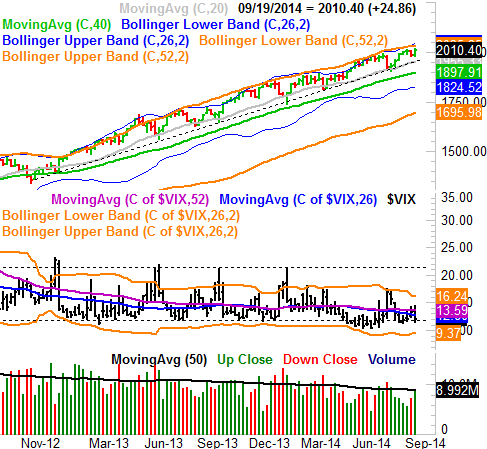
For what it's worth, the longer-term rally still stands. It's also crystal clear what it would take to break that trend, particularly on the S&P 500's chart. The same as last week, the support line that's guiding the S&P 500 higher has been in place since late 2012. It's currently at 1955, and we have to assume it will be a floor again if and when it's tested. (If it breaks though, look out below.)
S&P 500 & VXX – Weekly Chart
Bottom line: It's possible the market could rally straight away from here, and that Friday's stumble was just a one-day thing. Or, it's possible the market could see a soft patch and retest some minor floors, lifting the VXN and the VIX off their oddly-low lows. The near-term is a 50/50 proposition right now, and the outcome will depend on how things start on Monday; the first step out of the gate should point the way for a few days. Even if a pullback is in the cards though, there's plenty of support just a few points below where we closed out on Friday, which should keep the long-term uptrend intact either way.
None.


