
Long And Short Of Short Interest
Here is a brief review of period-over-period change in short interest in the March 1-15 period in nine S&P 500 sectors.
XLB (SPDR materials ETF)
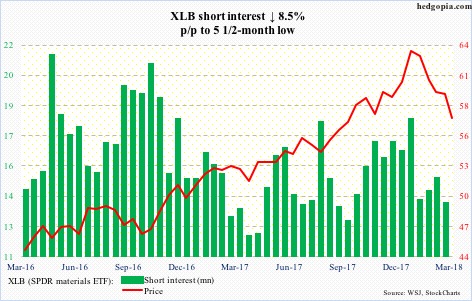
During last week’s selling, XLB (57.17) not only lost the 200-day moving average but also sliced through the prior low from February 9. Monday’s 2.1-percent rally retook the prior low. But resistance lies at the 200-day (57.86), and after that just north of 58.50.
The 50-day (60.57) – now sharply falling – has already been lost.
XLE (SPDR energy ETF)
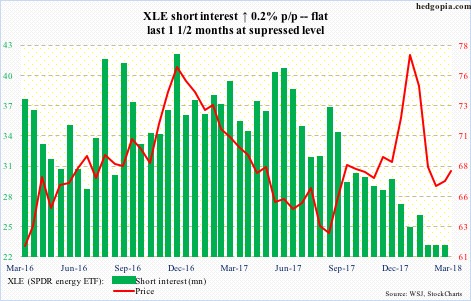
XLE (67.97) has diverged from spot West Texas Intermediate crude. Both bottomed on February 9, with the latter then carving out a rising channel while the former went sideways around its 200-day. Monday, it literally closed on that average.
The ETF is caught between 66.60 on the down and 68.70 on the up.
XLF (SPDR financial ETF)
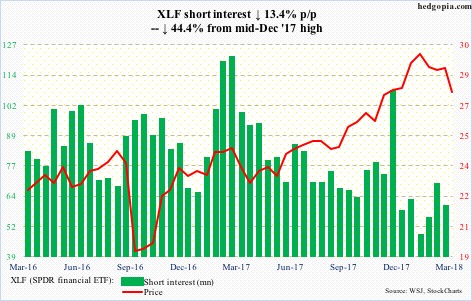
Two weeks ago, XLF (27.69) stopped moving in tandem with two-year Treasury yields. This preceded a loss of the 50-day. Last Friday, it came within a penny of matching the prior low of 26.76 from February 9. Monday’s rally brought the ETF just under broken support at 27.90. Overhead resistance is galore.
If the bears had their way, they would have liked to test support at 25.30, but that for now looks to have been averted.
XLI (SPDR industrial ETF)
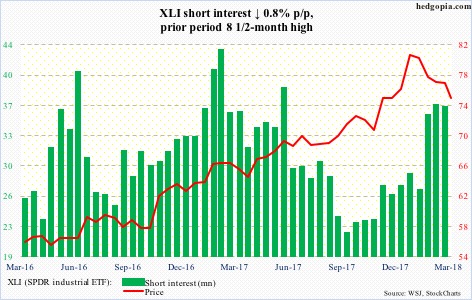
Last Friday, XLI (74.50) came within $0.34 of testing the 200-day (72.44). Shorts have gotten aggressive in the past month and a half, and have been proven right. This also raises the odds of a squeeze, should the bulls succeed in further building on Monday’s hammer candle.
Immediately ahead, resistance lies at 75-76.
XLK (SPDR technology ETF)
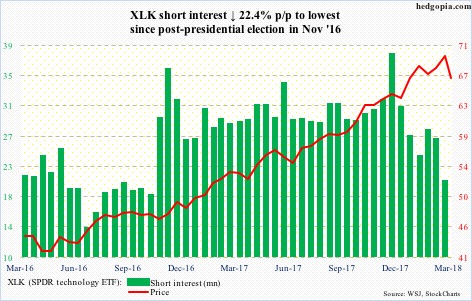
Shorts gave up. Short interest is now the lowest going back to mid-November 2016. Post-presidential election, they got very aggressive and paid the price. The latest urge to cover likely came as XLK (66.72) on March 9 broke past the prior high of 69.19 from January 26. Although the breakout lasted only six sessions, including a new high of 71.34 on the 13th which was hit in a bearish engulfing session.
After Monday’s reversal, resistance lies at the 50-day (67.51), and, if that gets taken out, just north of 69. The latter is important.
XLP (SPDR consumer stables ETF)
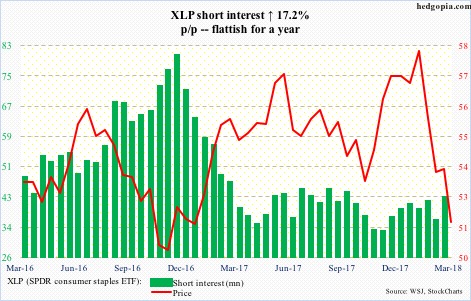
Last Friday, XLP (51.59) completed a death cross between the 50- and 200-day. This preceded a sustained drop since peaking at 58.95 on January 29. During last week’s selloff, support at 52-53 was lost as well. The daily chart is oversold. And a rally toward that broken-support-turned-resistance is the path of least resistance.
XLU (SPDR utilities ETF)
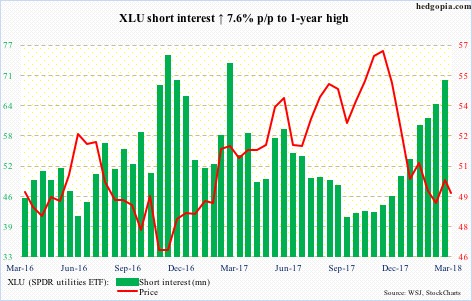
Fuel for short squeeze continues to build up on XLU (49.57).
The weekly chart is wanting to go higher. But for a month now the ETF has struggled at broken-support-turned-resistance at 50-50.50. The 50-day, which it has straddled for nearly as long, lies at 49.65.
The daily Bollinger bands are getting tighter. A sharp move – either way – is imminent.
XLV (SPDR healthcare ETF)
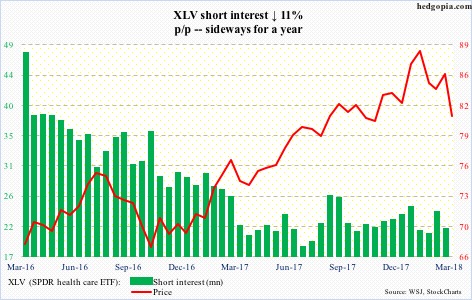
Since it got rejected on March 13 at the daily upper Bollinger band, XLV (81.32) proceeded to lose both the 50- and 200-day. After Monday’s hammer reversal, resistance immediately ahead lies at the latter average (82.35). Potential fuel for squeeze is lacking.
XLY (SPDR consumer discretionary ETF)
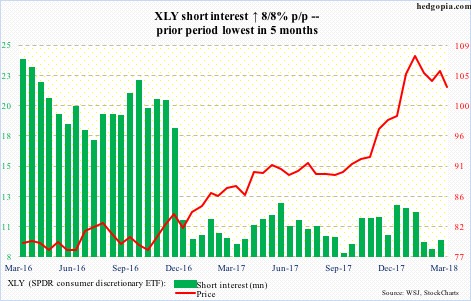
Between the record high of 109.34 on January 29 and the reversal low of 97.10 on February 9, XLY (103.14) traded within a symmetrical triangle, which it fell out of last week. The lower bound of the triangle gets tested around 105, which approximates the 50-day (104.89). This will be an important test, with fuel for short squeeze essentially absent.
Disclaimer: This article is not intended to be, nor shall it be construed as, investment advice. Neither the information nor any opinion expressed here constitutes an offer to buy or sell any ...
more

