
Light Thanksgiving Week Report 29 Nov, 2015
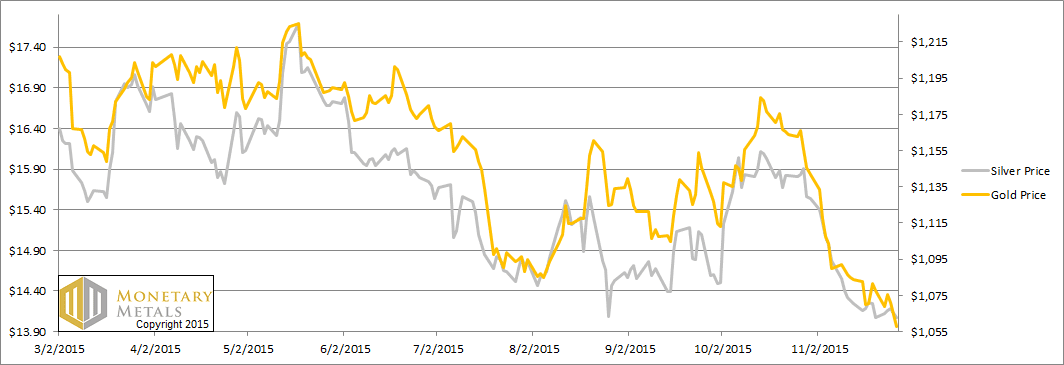
In this holiday-shortened week (Thanksgiving), the price of gold dropped $20 and silver 10 cents. Friday, when the price dropped the most, could not have had much liquidity as most Americans were out of work shopping or partying. Whatever they may have been buying, it sure wasn’t gold.
We might be inclined to take the basis data this week with a grain of salt.
Here’s the graph of the metals’ prices.
The Prices of Gold and Silver
We are interested in the changing equilibrium created when some market participants are accumulating hoards and others are dishoarding. Of course, what makes it exciting is that speculators can (temporarily) exaggerate or fight against the trend. The speculators are often acting on rumors, technical analysis, or partial data about flows into or out of one corner of the market. That kind of information can’t tell them whether the globe, on net, is hoarding or dishoarding.
One could point out that gold does not, on net, go into or out of anything. Yes, that is true. But it can come out of hoards and into carry trades. That is what we study. The gold basis tells us about this dynamic.
Conventional techniques for analyzing supply and demand are inapplicable to gold and silver, because the monetary metals have such high inventories. In normal commodities, inventories divided by annual production (stocks to flows) can be measured in months. The world just does not keep much inventory in wheat or oil.
With gold and silver, stocks to flows is measured in decades. Every ounce of those massive stockpiles is potential supply. Everyone on the planet is potential demand. At the right price, and under the right conditions. Looking at incremental changes in mine output or electronic manufacturing is not helpful to predict the future prices of the metals. For an introduction and guide to our concepts and theory, click here.
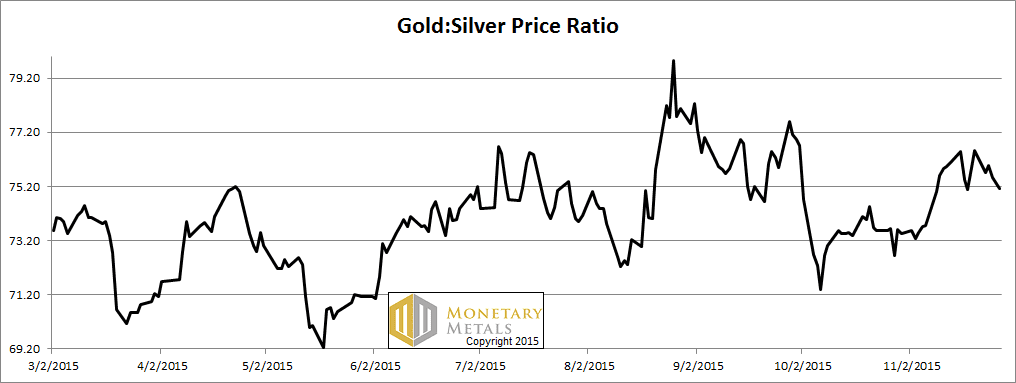
Next, this is a graph of the gold price measured in silver, otherwise known as the gold to silver ratio. The ratio fell this week.
The Ratio of the Gold Price to the Silver Price
For each metal, we will look at a graph of the basis and cobasis overlaid with the price of the dollar in terms of the respective metal. It will make it easier to provide brief commentary. The dollar will be represented in green, the basis in blue and cobasis in red.
Here is the gold graph.
The Gold Basis and Cobasis and the Dollar Price
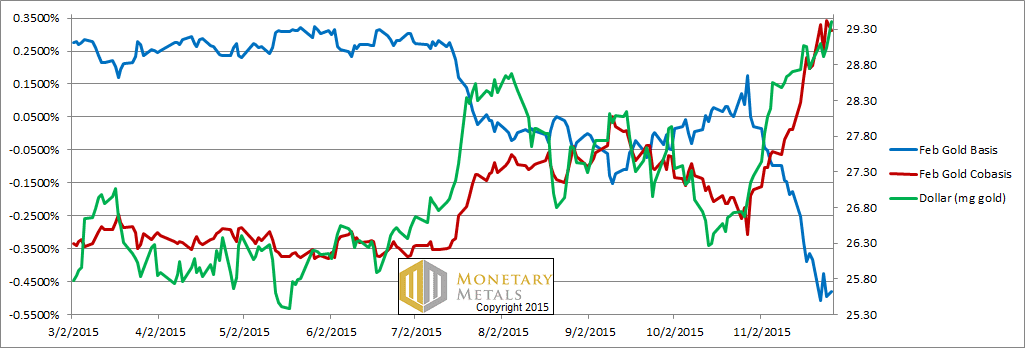
The price of gold dropped, but the cobasis (i.e. scarcity) actually fell on Friday. If this day weren’t halfway to a holiday, we would be inclined to read more into it. Monday will be telling…
Our calculated fundamental price of gold fell a few bucks more than the market price, though still about a hundred forty over market.
Now let’s look at silver.
The Silver Basis and Cobasis and the Dollar Price
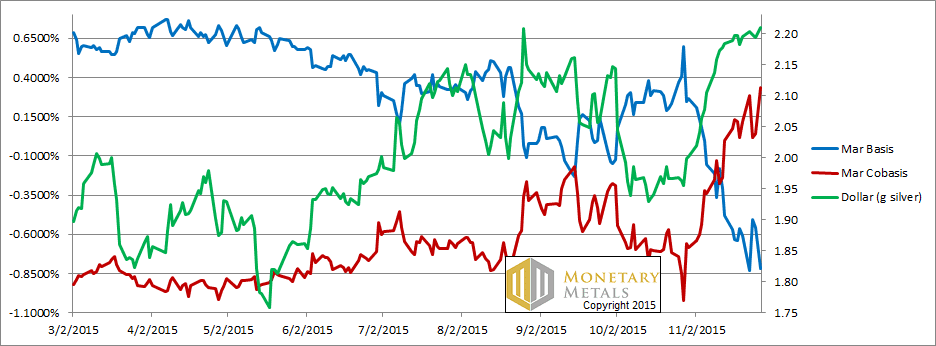
In silver, the cobasis was down the first part of the week though it rose on Friday ending up on the week.
The silver fundamental, like that of gold, also fell and also more than the market price. It is still a ways over the market price.
Monetary Metals and the Perth Mint are sponsoring a seminar in Sydney on Oct 28, to discuss economics and markets, with a focus on how to approach saving, investing, ...
more

