
Leading Indicators Suggest U.S. Economic Activity Approaching Stall Speed
In this article I will assess the strength of U.S. economic activity by analyzing the components of The Conference Board’s (hereafter “the CB”) Leading Economic Index, along with a few additional indicators. Overall, the analysis indicates a significant slowdown in U.S. economic activity, and the possibility of a recession in 2016, based on: 1) lack of growth in consumer and capital goods orders, 2) a range-bound stock market and flattening yield curve, 3) a multi-year trend of slowing sales growth, 4) unsustainable increases in business and consumer borrowing, 5) an elevated inventory-to-sales ratio, 6) commodity price deflation and 7) the complete exhaustion of Federal Reserve monetary policy.
The analysis method is to individually rank each Conference Board indicator -1, 0, or +1 (negative, neutral or positive, respectively) and to average these rankings two ways. The first way treats each indicator equally, while the second uses the weighting system employed by the CB. The possible range of scores is from -100%, which would represent a severe recession, to +100%, which would represent robust expansion. The summary table below previews the results of the analysis. According to the equally-weighted method, past, present and future economic activity in the U.S. has been hovering close to stall speed — neither expanding nor contracting (0% diffusion index values). Using the CB’s weightings, which more heavily emphasize manufacturing activity, interest rates and consumer sentiment, the U.S. economy is expected to remain in a sluggish, slow-growth mode for the first half of 2016 (a 23% diffusion index value corresponds to slow growth). If business activity continues decelerating, however, the economy will most likely slip into recession sometime in 2016.


The most heavily-weighted component is the Average Length of the Manufacturing Workweek (weight = 27.8%), shown below with the Average Length of the Construction Workweek. The manufacturing workweek has averaged 41.8 hours — exactly — for the past 8 months (which raises questions about the validity of the reported data). The length of the construction workweek is also at multi-year highs.
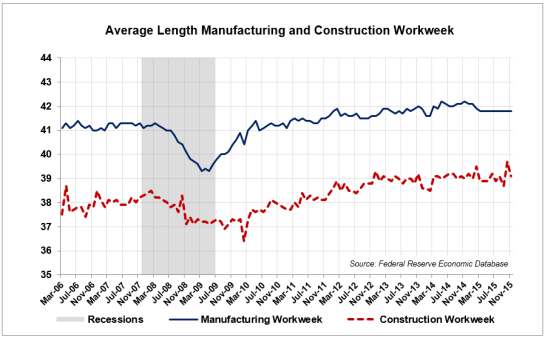
In the chart below, I compare the manufacturing workweek to total manufacturing employment. Despite my doubts about the accuracy of the workweek data, the increase in manufacturing employment since 2010 convinces me to rank this indicator +1.

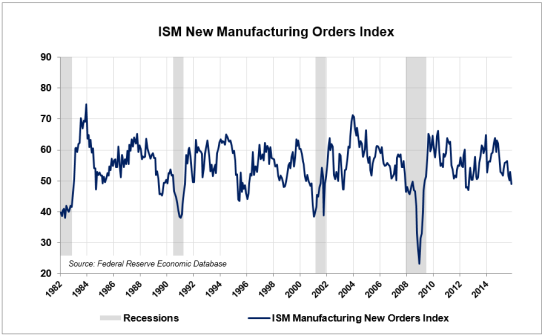
The second leading indicator is the ISM’s New Manufacturing Orders Index, weight = 16.5% (notice that the first two indicators make up 44% of the weightings in the CB’s Leading Index). The ISM index has recently plunged below the contractionary level of 50, which earns it a ranking of -1. (The recent downtrend in this indicator casts further doubt on the accuracy of the manufacturing workweek numbers — declining activity should be accompanied by a declining average workweek).
The University of Michigan’s Consumer Sentiment Index (weight = 15.5%) has also exhibited unusual behavior, spiking sharply higher despite 1) increased financial market volatility, 2) contradictory and confusing announcements by the Federal Reserve Bank, and 3) increased geopolitical tensions. Despite all that, I will give the indicator the benefit of the doubt and assign it a score of +1.

Interest Rate Spread Between the 10-year T-Note and the Fed Funds Rate (weight = 10.7%). This indicator is really a proxy for the slope of the yield curve. A steeply-sloped yield curve indicates economic expansion, while a flat or inverted yield curve indicates slowdown or contraction. The curve has recently flattened as longer-term rates have slumped and short-term rates have risen slightly, in anticipation of the long-awaited Fed Funds increase. The 2% spread is typical for the middle of an economic expansion, but with the Fed’s central planners maniacally pinning the Fed Funds rate at zero for the past 7 years, the indicator cannot be rated higher than zero.

Manufacturers’ New Orders for Consumer Goods (weight = 8.1%). Nominal and real Durable Goods Orders (deflated by the Personal Consumption Expenditure Index, or PCE) are shown below. After climbing sharply during the years following the last recession, the indicator has contracted sharply in 2014-2015. Moreover, the inflation-adjusted series shows zero growth over the past 15 years. The indicator therefore merits a score of -1.

The Conference Board’s proprietary Leading Credit Index is replaced by The Chicago Fed’s National Financial Conditions Index (weight = 7.9%). Lower levels indicate “looser” borrowing conditions. Access to credit remains easy, especially for this stage of an economic expansion, so I’ll rate this indicator +1.

The +1 rating is on the generous side, however, as demonstrated by the following graph depicting total borrowing by U.S. businesses and consumers. Both have increased at historically high rates since 2010, a trend which is not sustainable. (Total business credit is an official CB lagging indicator.)

The ratio of consumer credit to personal income, another CB lagging indicator, is at an all-time high of 22.5%, further confirming the unsustainability of the debt binge. It’s unpleasant to contemplate the effect on U.S. consumers’ spending power if the Fed raises rates, and payments on all adjustable-rate loans for consumers rise.

Level of the S&P 500 (weight = 3.8%). After rising dramatically since 2009, the S&P 500 has remained in a trading range for all of 2015, while volatility has increased sharply. I will generously assign this indicator a score of zero.

Manufacturers’ New Orders for Capital Goods (weight = 3.6%). Capital Goods orders show a contraction similar to Durable Goods, and the inflation-adjusted Capital Goods Orders index has been in a 15-year downtrend. The indicator earns a score of -1.

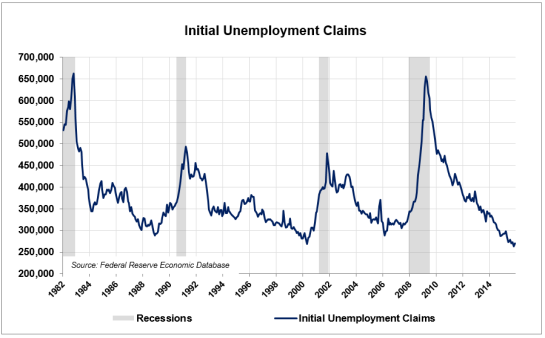
Initial Unemployment Claims (weight = 3.3%). Unemployment claims continue trending lower. What could be the problem? As the chart shows, consistent readings below 300,000 usually occur late in a business cycle expansion. This indicator therefore rates a score of zero.
Building Permits for New Private Housing Units (weight = 2.7%). This indicator continues advancing, but remains far lower than the levels achieved in each of the two prior expansions. I will therefore rate the indicator zero.

A summary of the individual scores for each leading indicator and their weighted and unweighted averages are shown below. This marks the third year in a row that my ranking of the Leading Indicators has been in decline. Overall, the analysis implies that economic momentum will continue declining through at least the first half of 2016. For the first time since 2009, the U.S. economy is showing signs that it may slip into recession sometime in 2016.

Additional concerns. Despite all the excessive borrowing described above, U.S. GDP growth has barely averaged +2.0% during the current expansion.

Another concern arises due to the behavior of the inventory-to-sales ratio, which will hamper GDP growth in future periods as businesses reduce production and liquidate excess inventory at reduced prices.

Global deflation is one of my most serious concerns. The chart below shows the 1-year price change for oil, coal, copper, aluminum, lead, zinc and nickel. All are negative, with declines ranging from -12% and -45%.

Agricultural commodities are also in a deflationary spiral, as shown below. Although cotton and cocoa exhibit slight increases in price (after declining in 2014), the prices of corn, oats, wheat, soybeans and coffee are in a long-term decline, ranging from -7% to -30% year-over-year. Deflation is an unmistakable sign of global economic weakness.

Finally, one of my new official concerns is the blatantly positive bias of the U.S. financial media, which has now been fully captured by corporate interests. The age of objective journalism is over. Consider this Bloomberg headline from December 11:

The headline makes it sound as if sales are ripping higher. After considering the trend in retail sales growth depicted below, however (declining from 2012-2015), a more accurate headline might be “Retail Sales Growth Slows To Zero”:

Summary. The Conference Board’s Leading Economic Indicators have deteriorated significantly over the past year. Lack of growth in consumer and capital goods orders, a range-bound stock market and flattening yield curve, slowing sales growth, unsustainable increases in business and consumer borrowing, an upward-trending inventory-to-sales ratio, deflation in physical and agricultural commodities and the utter exhaustion of both conventional and unconventional Federal Reserve monetary policy all suggest that the 6-year economic expansion is running out of steam. A significant probability exists that the U.S. economy will slide into recession sometime in 2016.


