
Leadership (Bio-Tech) Breakout; Good Sign For Broad Market

When looking back 5-years, what sector has double the performance of the S&P 500? How is this sector doing of late?
Below looks at the Bio-Tech ETF XBI since 2012. The chart reflects that over the past 5-years the S&P had done very well, as it is up 70%. Over the same time frame XBI is up 160%, gaining more than 100% more than the broad markets.
(Click on image to enlarge)
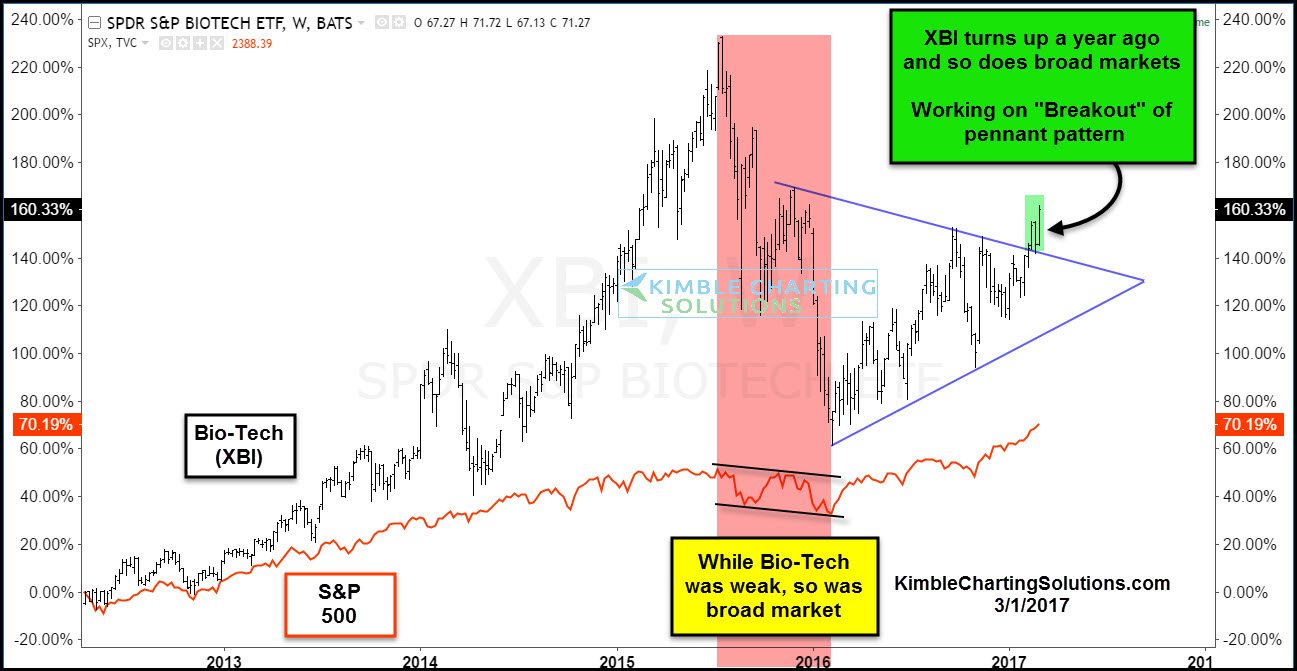
Bio-Tech looks to have influenced the broad markets, as it declined from the summer of 2015 until Feb of 2016, the S&P did too. Once Bio-Tech turned higher 1-year ago, the broad market has followed along, although the broad market has lagged this leading sector since the lows.
Currently XBI is working on a breakout of a year long pennant pattern, to the upside. If history continues to repeat, what this leading sector does going forward, will have a big influence on the broad markets. Risk on stock trade wants to see XBI clear the highs of late 2015 (where the top of the pennant pattern started). This level comes into play as a resistance test.
Disclosure: Sign up for Chris's Kimble Charting Solutions' email alerts -- more


My Simple Forecast:
Looks like $XBI has had a positive growth trend. With middle of the year approaching I believe that the cycle will repeat, thus hitting high points again. The seasonal patterns may be based on the rate of discovery of new technology, so cycles may be of unusual lengths. Nonetheless, looks like $XBI is positively correlated to SP500, and it is leading variable. We can anticipate new highs by beginning Q3.