
J.C. Penney Reports $1.1 Billion Increase In Ebitda For Fiscal 2014
JCPenney Corporate Press Release
PLANO, Texas - (Feb. 26, 2015) - J. C. Penney Company, Inc. (NYSE: JCP) today announced financial results for its fiscal fourth quarter and full year ended Jan. 31, 2015. Comparable store sales grew 4.4 percent for both the fourth quarter and full fiscal year. The combination of this sales improvement, stronger gross margins and decreasing SG&A expense resulted in a $1.1 billion increase in EBITDA for the year.
Myron E. (Mike) Ullman, III, chief executive officer, said, "2014 was a successful year for JCPenney. Thanks to the hard work and outstanding execution by our teams, we significantly grew sales and gross margin and delivered on our goal to generate positive free cash flow, representing a $2.8 billion improvement over last year. I am extremely proud of all that has been accomplished to restore this great Company. We are back in the eyes of our customers, back running the business effectively and back on solid financial footing. We fully intend to build on this momentum and continue to significantly improve our business in 2015."
Marvin Ellison, president and CEO-designee, said, "I have been very impressed by what I have seen in my first few months at JCPenney. The passion and knowledge of our associates and their dedication to customer service is helping us take back share from our competitors, as we continue to find new ways to put the customer first. I believe 2015 will be an important year for JCPenney, and the team is focused on profitably executing our business."
Fourth Quarter Results
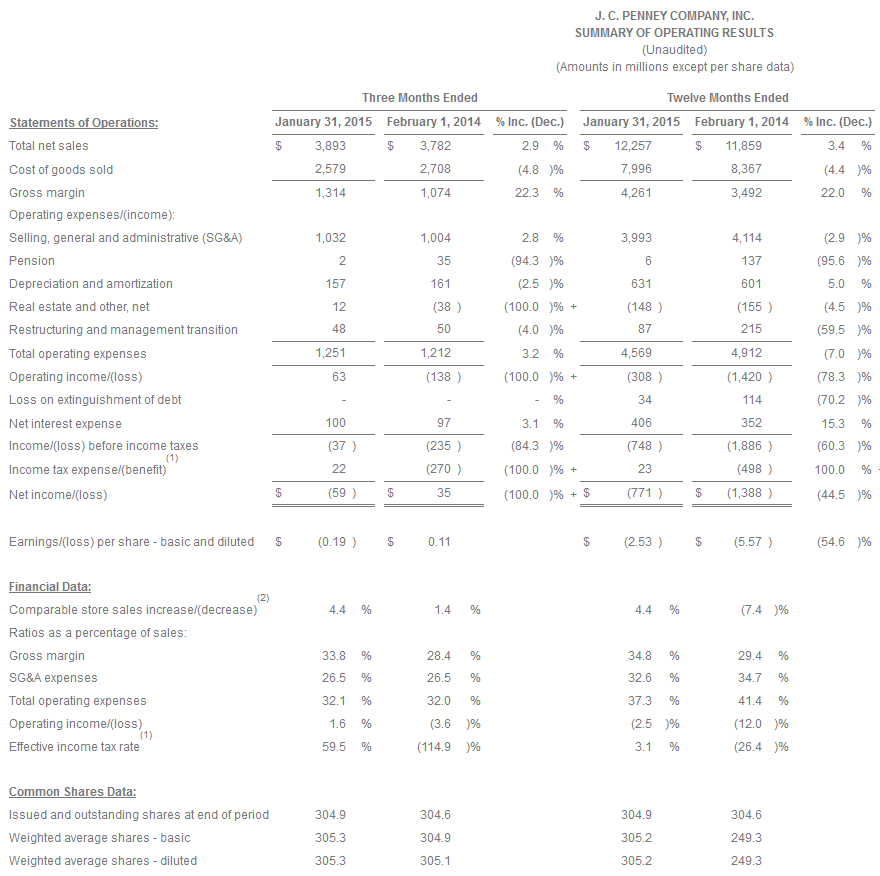
For the fourth quarter, which included a successful holiday season, JCPenney reported net sales of $3.89 billion compared to $3.78 billion in the fourth quarter of 2013. Comparable store sales rose 4.4 percent for the quarter. Online sales through jcpenney.com were $428 million for the quarter, up 12.5 percent versus the same period last year.
Men's apparel, Home and Fine Jewelry were the Company's top performing merchandise divisions during the quarter. Sephora inside JCPenney, now in 492 locations, also continued its strong performance. Geographically, all regions delivered sales gains over the same period last year with the best performance in the central and western regions of the country.
For the fourth quarter, gross margin improved 540 basis points to 33.8 percent of sales, compared to 28.4 percent in the same quarter last year. Gross margin was positively impacted by significant improvement in the Company's merchandise mix and margin on clearance sales over the prior year quarter.
SG&A expenses for the quarter were up $28 million to $1.032 billion, or 26.5 percent of sales.
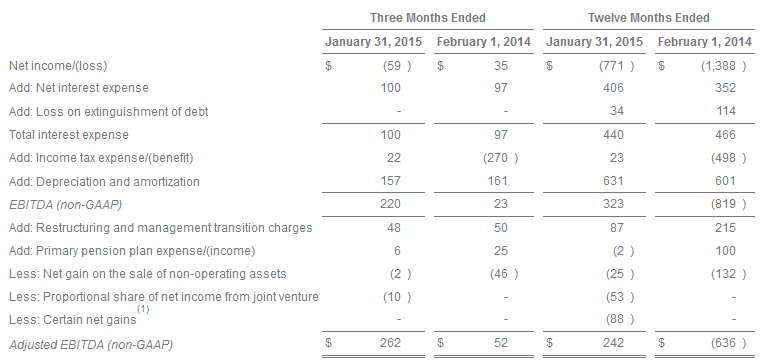
Operating income for the quarter was $63 million, which represents a $201 million increase over last year. EBITDA was $220 million, a $197 million improvement from the same period last year.
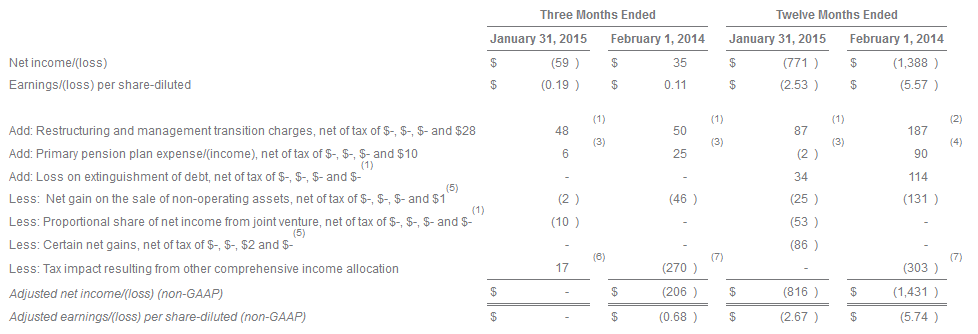
Adjusted net income for the fourth quarter improved $206 million to breakeven. Net income for the quarter was a loss of $59 million, compared to a gain of $35 million in last year's fourth quarter, which benefitted from a one-time $270 million non-cash tax credit. These income tax changes resulted in a negative year over year impact of $292 million on the Company's reported net income.
A reconciliation of GAAP to non-GAAP financial measures is included in the schedules accompanying the consolidated financial statements in this release.
Full Year Results
For the full year 2014, comparable store sales increased 4.4 percent. Total sales increased 3.4 percent for the year. Internet sales through jcpenney.com grew $145 million to $1.22 billion for the year, increasing 13.4 percent over last year.
For the year, gross margin increased 540 basis points to 34.8 percent from 29.4 percent in the prior year. SG&A decreased $121 million or 210 basis points compared to the prior year.
EBITDA was $323 million, a more than $1.1 billion improvement from last year.
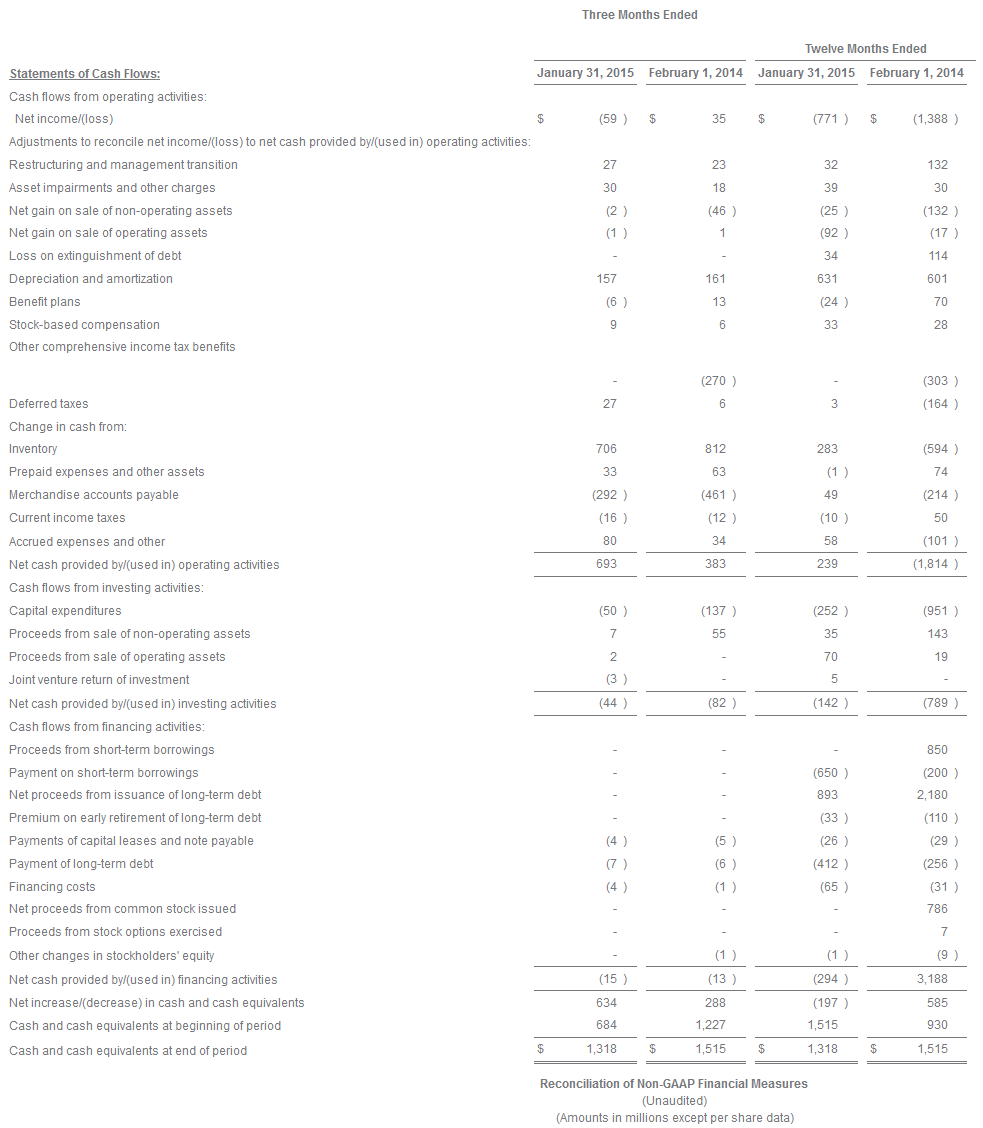
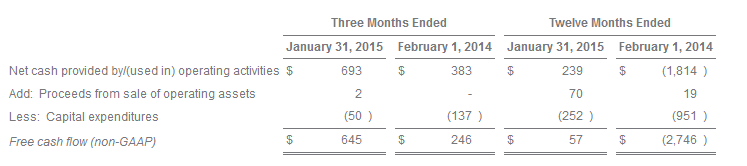
Free cash flow was $57 million, a positive increase of over $2.8 billion.
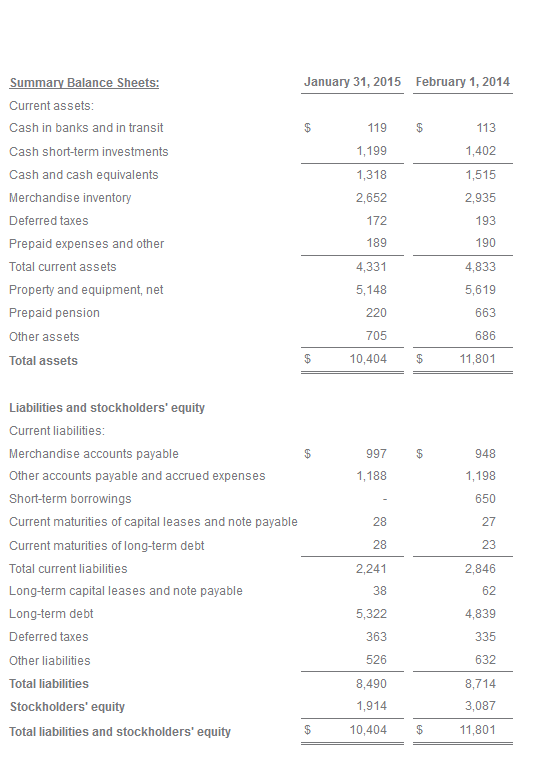
The Company ended the year with liquidity of approximately $2.1 billion.
In 2014, the Company opened its first ever store in Brooklyn, N.Y., giving JCPenney a location in all five boroughs of New York City. The Company opened 46 Sephora inside JCPenney boutiques, bringing the total to 492 locations, and announced plans to open 25 additional locations in 2015. In addition, JCPenney, which carries an exclusive assortment of Disney merchandise, is capitalizing on the success of its Disney-branded Shops inside JCPenney by opening an additional 100 locations by back-to-school 2015, bringing the total to nearly 700 locations.
Outlook
Building on the success of 2014, the Company's 2015 full year guidance is as follows:
-
Comparable store sales: expected to increase 3 percent to 5 percent;
-
Gross margin: expected to improve 50 to 100 basis points versus 2014;
-
SG&A: expected to decrease $50 to $100 million versus 2014;
-
Primary pension plan expense: approximately $19 million;
-
Depreciation and amortization: approximately $615 million;
-
Interest expense: approximately $415 million; and
-
Free cash flow: expected to be flat.
Fourth Quarter and Full Year 2014 Earnings Conference Call Details
At 4:30 p.m. ET today, the Company will host a live conference call conducted by Chief Executive Officer Myron E. (Mike) Ullman, III, President and CEO-Designee Marvin Ellison and Chief Financial Officer Ed Record. Management will discuss the Company's performance during the quarter and take questions from participants. To access the conference call, please dial (877) 415-3179, or (857) 244-7322 for international callers, and reference 49326884 participant code or visit the Company's investor relations website at http://ir.jcpenney.com.
Telephone playback will be available approximately two hours after the conclusion of the meeting by dialing (888) 286-8010, or (617) 801-6888 for international callers and referencing 46764699 participant code.
Investors and others should note that we currently announce material information using SEC filings, press releases, public conference calls and webcasts. In the future, we will continue to use these channels to distribute material information about the Company and may also utilize our website and/or various social media to communicate important information about the Company, key personnel, new brands and services, trends, new marketing campaigns, corporate initiatives and other matters. Information that we post on our website or on social media channels could be deemed material; therefore, we encourage investors, the media, our customers, business partners and others interested in our Company to review the information we post on our website as well as the following social media channels:
Facebook (https://www.facebook.com/jcp) and Twitter (https://twitter.com/jcpnews).
Any updates to the list of social media channels we may use to communicate material information will be posted on the Investor Relations page of the Company's website at www.jcpenney.com
Media Relations:
(972) 431-3400 or jcpnews@jcp.com
Investor Relations:
(972) 431-5500 or jcpinvestorrelations@jcpenney.com
About JCPenney:
J. C. Penney Company, Inc. (NYSE: JCP), one of the nation's largest apparel and home furnishing retailers, is dedicated to fitting the diversity of America with unparalleled style, quality and value. Across approximately 1,060 stores and at jcpenney.com, customers will discover a broad assortment of national, private and exclusive brands to fit all shapes, sizes, colors and wallets. For more information, please visit jcpenney.com.
Forward-Looking Statements
This release may contain forward-looking statements within the meaning of the Private Securities Litigation Reform Act of 1995. Words such as "expect" and similar expressions identify forward-looking statements, which include, but are not limited to, statements regarding sales, gross margin, selling, general and administrative expenses, and cash flows. Forward-looking statements are based only on the Company's current assumptions and views of future events and financial performance. They are subject to known and unknown risks and uncertainties, many of which are outside of the Company's control that may cause the Company's actual results to be materially different from planned or expected results. Those risks and uncertainties include, but are not limited to, general economic conditions, including inflation, recession, unemployment levels, consumer confidence and spending patterns, credit availability and debt levels, changes in store traffic trends, the cost of goods, more stringent or costly payment terms and/or the decision by a significant number of vendors not to sell us merchandise on a timely basis or at all, trade restrictions, the ability to monetize non-core assets on acceptable terms, the ability to implement our strategic plan, customer acceptance of our strategies, our ability to attract, motivate and retain key executives and other associates, the impact of cost reduction initiatives, our ability to generate or maintain liquidity, implementation of new systems and platforms, changes in tariff, freight and shipping rates, changes in the cost of fuel and other energy and transportation costs, disruptions and congestion at ports through which we import goods, increases in wage and benefit costs, competition and retail industry consolidations, interest rate fluctuations, dollar and other currency valuations, the impact of weather conditions, risks associated with war, an act of terrorism or pandemic, the ability of the federal government to fund and conduct its operations, a systems failure and/or security breach that results in the theft, transfer or unauthorized disclosure of customer, employee or Company information, legal and regulatory proceedings and the Company's ability to access the debt or equity markets on favorable terms or at all. There can be no assurances that the Company will achieve expected results, and actual results may be materially less than expectations. Please refer to the Company's most recent Form 10-Q for a further discussion of risks and uncertainties. Investors should take such risks into account and should not rely on forward-looking statements when making investment decisions. Any forward-looking statement made by us in this press release is based only on information currently available to us and speaks only as of the date on which it is made. We do not undertake to update these forward-looking statements as of any future date.
-
For the three and twelve months ended January 31, 2015, the Company increased its net valuation allowance by $56 million and $311 million, respectively, against certain federal and state net operating loss carry forward assets. For the three and twelve months ended February 1, 2014, the Company decreased its net valuation allowance by $178 million and increased its net valuation allowance by $238 million, respectively, against certain federal and state net operating loss carry forward assets. In addition, the three months ended February 1, 2014 and the last nine months of fiscal 2013 includes $270 million and $303 million, respectively, of tax benefits related to the allocation of tax expense to other comprehensive income items, including the amortization of actuarial losses and prior service costs related to the Primary Pension Plan and the results of the Company's annual remeasurement of its pension plans.
-
Beginning in the first quarter of 2014, the Company simplified its comparable store sales calculation to better reflect year-over-year comparability. Certain items, such as sales return estimates and store liquidation sales, are now excluded from the Company's calculation. Prior periods have been adjusted to reflect the new methodology.
SUMMARY BALANCE SHEETS
(Unaudited)
(Amounts in millions)
SUMMARY STATEMENTS OF CASH FLOWS
(Unaudited)
(Amounts in millions)
We report our financial information in accordance with generally accepted accounting principles in the United States (GAAP). However, we present certain financial measures and ratios identified as non-GAAP under the rules of the Securities and Exchange Commission (SEC) to assess our results. We believe the presentation of these non-GAAP financial measures and ratios is useful in order to better understand our financial performance as well as to facilitate the comparison of our results to the results of our peer companies. In addition, management uses these non-GAAP financial measures and ratios to assess the results of our operations. It is important to view non-GAAP financial measures in addition to, rather than as a substitute for, those measures and ratios prepared in accordance with GAAP. We have provided reconciliations of the most directly comparable GAAP measures to our non-GAAP financial measures presented.
The following non-GAAP financial measures are adjusted to exclude restructuring and management transition charges, the impact of our qualified defined benefit pension plan (Primary Pension Plan), the loss on extinguishment of debt, the net gain on the sale of non-operating assets, certain net gains, the proportional share of net income from our joint venture formed to develop the excess property adjacent to our home office facility in Plano, Texas (Home Office Land Joint Venture) and tax impact related to the allocation of tax expense to other comprehensive income items. Unlike other operating expenses, restructuring and management transition charges, the loss on extinguishment of debt, the net gain on the sale of non-operating assets, certain net gains, the proportional share of net income from the Home Office Land Joint Venture and tax impact related to the allocation of tax expense to other comprehensive income items are not directly related to our ongoing core business operations. Primary Pension Plan expense/(income) is determined using numerous complex assumptions about changes in pension assets and liabilities that are subject to factors beyond our control, such as market volatility. Accordingly, we eliminate our Primary Pension Plan expense/(income) in its entirety as we view all components of net periodic benefit expense/(income) as a single, net amount, consistent with its presentation in our Consolidated Financial Statements. We believe it is useful for investors to understand the impact of restructuring and management transition charges, Primary Pension Plan expense/(income), the loss on extinguishment of debt, the net gain on the sale of non-operating assets, certain net gains, the proportional share of net income from the Home Office Land Joint Venture and tax impact related to the allocation of tax expense to other comprehensive income items on our financial results and therefore are presenting the following non-GAAP financial measures: (1) adjusted net income/(loss) before net interest expense, income tax (benefit)/expense and depreciation and amortization (adjusted EBITDA); (2) adjusted net income/(loss); and (3) adjusted earnings/(loss) per share-diluted.
In addition, we believe that EBITDA is a useful measure in assessing our operating performance and are therefore presenting this non-GAAP financial measure in addition to the non-GAAP financial measures listed above.
EBITDA AND ADJUSTED EBITDA, NON-GAAP FINANCIAL MEASURES:
The following table reconciles net income/(loss), the most directly comparable GAAP measure, to EBITDA and adjusted EBITDA, non-GAAP financial measures:
-
Represents the net gain on the sale of one department store location and the net gain recognized on a payment received from a landlord to terminate an existing lease prior to its original expiration date.
ADJUSTED NET INCOME/(LOSS) AND ADJUSTED EARNINGS/(LOSS) PER SHARE-DILUTED, NON-GAAP FINANCIAL MEASURES:
The following table reconciles net income/(loss) and earnings/(loss) per share-diluted, the most directly comparable GAAP measures, to adjusted net income/(loss) and adjusted earnings/(loss) per share-diluted, non-GAAP financial measures:
The following table reconciles net income/(loss) and earnings/(loss) per share-diluted, the most directly comparable GAAP measures, to adjusted net income/(loss) and adjusted earnings/(loss) per share-diluted, non-GAAP financial measures:
-
Reflects no tax effect due to the impact of the Company's tax valuation allowance.
-
For the three months ended May 4, 2013, tax effect was calculated using the Company's statutory rate of 38.82%. The last nine months of fiscal 2013 reflects no tax effect due to the impact of the Company's tax valuation allowance.
-
The tax effect is included in the line item Tax impact resulting from other comprehensive income allocation. See footnote 6 below.
-
For the three months ended May 4, 2013, tax effect was calculated using the Company's statutory rate of 38.82%. Tax benefit for the last nine months of fiscal 2013 is included in the line item Tax impact resulting from other comprehensive income allocation. See footnote 6 below.
-
Tax effect was calculated using the effective tax rate for the transactions.
-
Represents the tax impact for the reversal of tax benefits recognized during the first nine months of fiscal 2014 related to the allocation of tax expense in other comprehensive income for the amortization of actuarial losses and prior service costs related to the Primary Pension Plan.
-
Represents the tax benefits related to the allocation of tax expense to other comprehensive income items, including the amortization of actuarial losses and prior service costs related to the Primary Pension Plan and the results of the Company's annual remeasurement of its pension plans.
Reconciliation of Non-GAAP Financial Measures
(Unaudited)
(Amounts in millions)
Free cash flow is a key financial measure of our ability to generate additional cash from operating our business and in evaluating our financial performance. We define free cash flow as cash flow from operating activities, less capital expenditures, plus the proceeds from the sale of operating assets. Free cash flow is a relevant indicator of our ability to repay maturing debt, revise our dividend policy or fund other uses of capital that we believe will enhance stockholder value. Free cash flow is considered a non-GAAP financial measure under the rules of the SEC. Free cash flow is limited and does not represent remaining cash flow available for discretionary expenditures due to the fact that the measure does not deduct payments required for debt maturities, pay-down of off-balance sheet pension debt, and other obligations or payments made for business acquisitions. Therefore, it is important to view free cash flow in addition to, rather than as a substitute for, our entire statement of cash flows and those measures prepared in accordance with GAAP.
FREE CASH FLOW, NON-GAAP FINANCIAL MEASURE:
The following table reconciles cash flow from operating activities, the most directly comparable GAAP measure, to free cash flow, a non-GAAP financial measure:
Disclosure: None.


My perspective is different. JCP has reached a point where the numbers start to make sense, yet the market hasn't realized it yet. $20 SOON.
"The problem is that their business model does not make sense." Really? Malls don't make sense?
I see a huge drop in after hours and a failure to meet EPS.