
It’s Time To Invest In A Housing Recovery
The last week of May brought some ill economic tidings as we start the last month of the second quarter. First quarter GDP growth was revised down from an already anemic annual rate of 0.2% to show a contraction of 0.7% in the opening stanza of 2015. Chicago PMI also came in way below expectation and shows the manufacturing sector under strain. Even Canada had a recent bout of weakness. Our neighbor to the north posted a negative GDP of 0.6% in the first quarter. This was the first negative quarterly reading in four years and the worst economic performance since the financial crisis in 2009.
The domestic economy should rebound in the second quarter. However, it will not be the four to five percent boomlet we saw in the second and third quarters of last year after a horrid winter. Based on current consensus forecasts the second quarter should produce growth of approximately two percent in the quarter that closes at the end of this month. If correct, this would be the slowest consecutive two quarters of growth since 2011, and will put pressure on the bull market of the last six years.
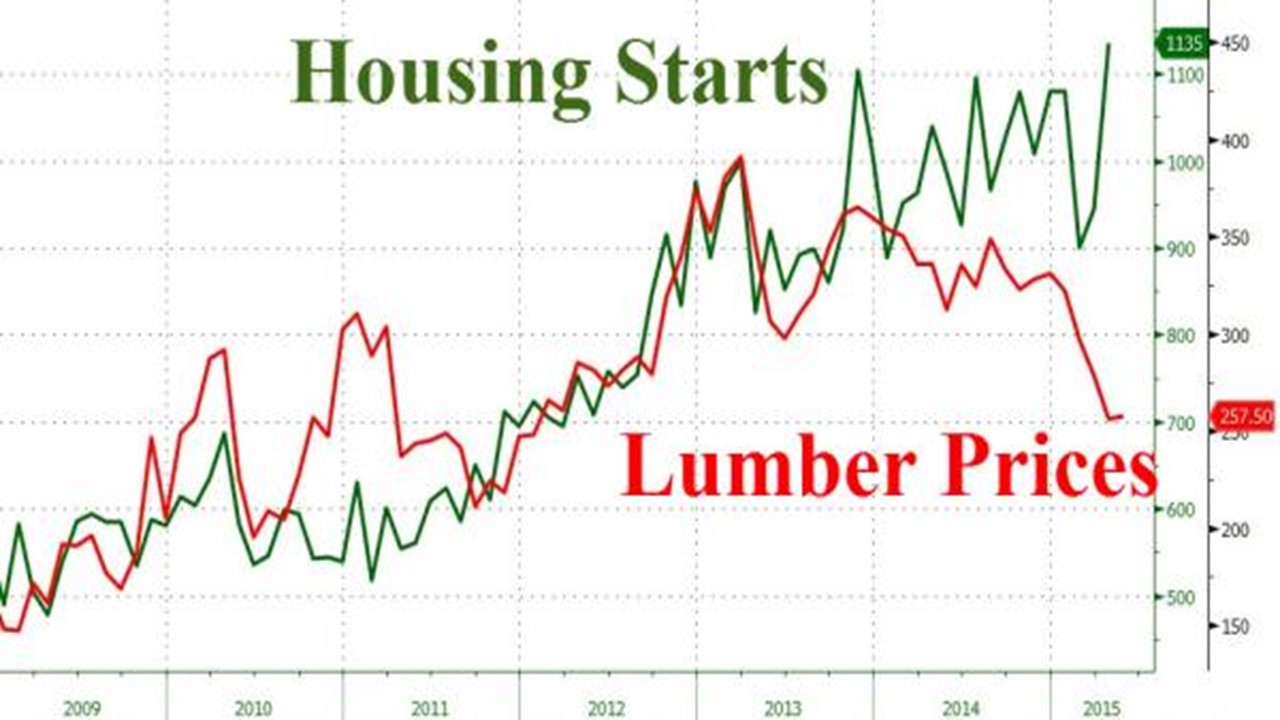
One of the best looking areas of the economy right now for outsized gains this year is the housing market. April housing starts came in at a seasonally adjusted annualized rate of 1.14 million. This was up 20% above the levels of March. It was also the strongest pace since the housing collapse began to pick up pace in 2006. Monthly new home sales have averaged 515,000 over the first four months of the year. This is a big improvement from the monthly averages of 440,000 in 2014 and 430,000 in 2013 over the same time period. This trend has been strengthening as of late, and that could very well make housing stocks some of the best performers in 2015.
Even though housing starts are at their highest level in some eight years, they are far below “normalized” levels of the 1.5 million annual housing starts the country has averaged over the past three decades. Housing starts would have to rise more than 30% from April’s level just to reach the average housing activity the country has experienced over the last 30 years. This means the housing recovery could be in the very early innings of a sustained move to higher activity levels. Encouragingly this faster pace of builds has not led to a rise in lumber prices as of yet.
Ironically, one thing keeping new home sales from being even higher right now is the lack of inventory. The median price of a house recently rose 8.3% year-over-year to $297,000, which is more than $40,000 above levels in 2007. This bodes well for further increases in new home sales and housing starts.
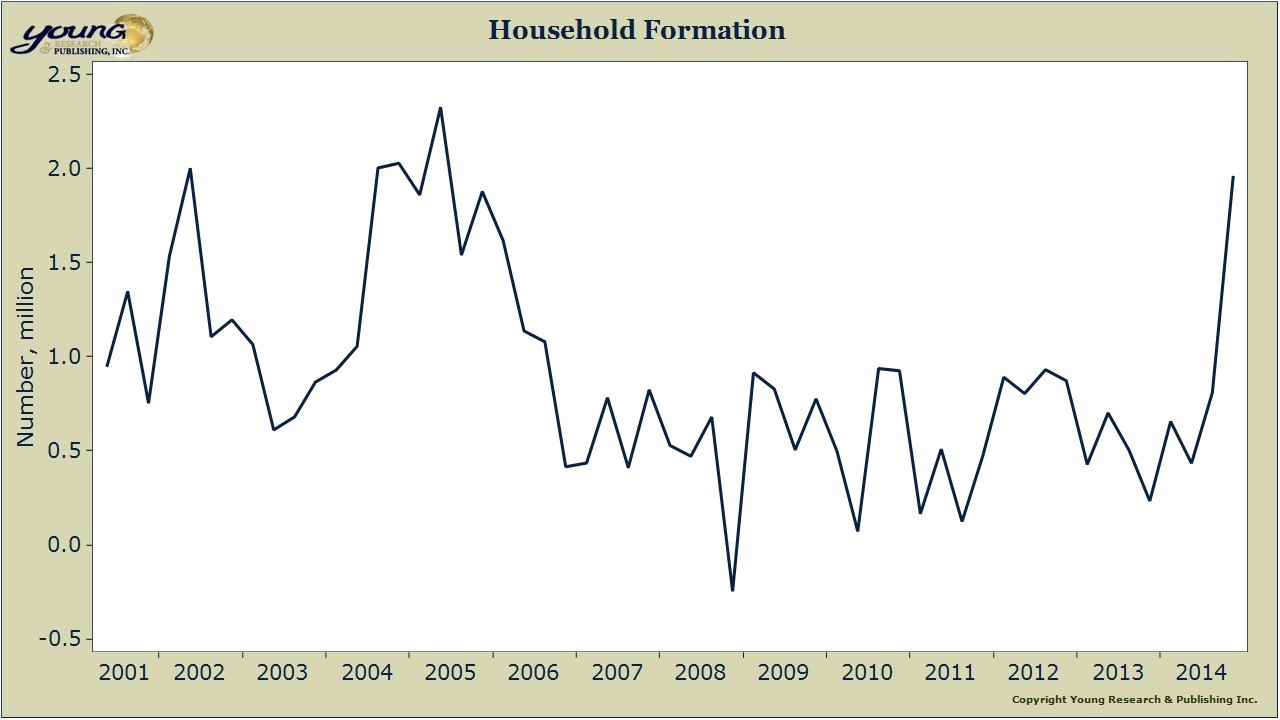
In addition, household formation is increasing and there are some twenty million more people in the country than prior to the financial crisis. During the height and immediate aftermath of the crisis, household formation plunged to just 500,000 to 600,000 a quarter. Household formation has bounced back and has averaged 1.6 million over the past two quarters. This obviously bodes well for future housing demand.
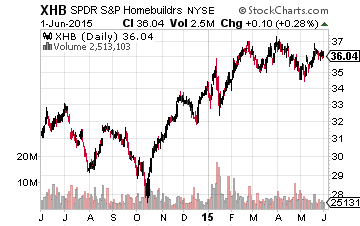
For the above reasons, I am overweight the homebuilders within my own portfolio as we are in the critical spring selling season and as a strong summer looms large over the horizon. For investors who want to do the same, probably the easiest way is to establish a position in the SPDR Homebuilders ETF (NYSE: XHB) to quickly pick up a well-diversified stake in what should be a strong sector going forward based on increased housing activity.
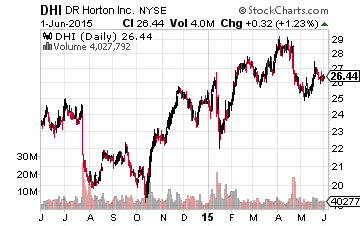
Stepping out a bit on the risk curve, large homebuilder D.R. Horton (NYSE: DHI) makes sense here. The homebuilder is represented in the luxury sector which has been the strongest part of the market over the past few years. The company also has offerings in the mid and lower tiers of the market which should benefit if strength broadens throughout the market which it appears to be starting to do. D.R. Horton is geographically diversified and is slightly cheaper at under 13 times forward earnings than its peers. Earnings should grow at an average annual rate of approximately 20% over the next few years according to current consensus estimates.
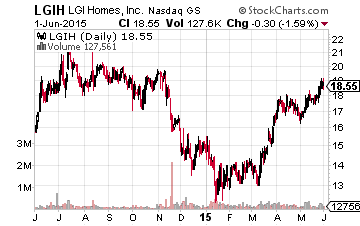
Investors looking for a higher risk/reward play in the space should look into small homebuilder LGI Homes (NASDAQ: LGIH) which has posted solid performance since being included in the Small Cap Gems portfolio two months ago. After earning $1.33 a share in FY2014, earnings are tracking to an approximate $2.00 a share profit in FY2015. The consensus has LGIH earning $2.70 a share in FY2016. The stock is very cheap at seven times next year’s earnings projections and the shares have a five year projected PEG of approximately 0.5.
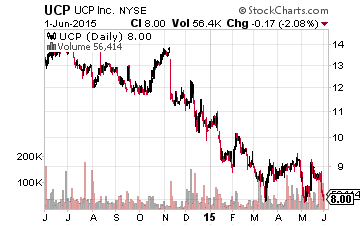
Finally, we have UCP Inc. (NYSE: UCP), an under the radar homebuilding play based primarily in Northern California. As new communities come on line revenues should increase at better than a 50% annual average pace over the next couple of years. This will have a huge impact in earnings as well. The company posted a loss of just over 60 cents a share in FY2014, but that should narrow to a loss of just a dime a share or maybe even breakeven this fiscal year. UCP could post a profit of up to 50 cents a share in FY2016. More importantly, 70% of its lot inventory was acquired between 2008 to 2010 when land prices were much, much lower. The stock trades at just three quarters of an understated book value and is a solid asset play here.
Disclosure: Long LGIH, UCP
For more on how I find these winners and how you can too, more


Are we really out of the housing doldrums? Over the past 7 years, 2008, consumers for the most part have faced a much harder process in qualifying for a mortgage, and 0% down loans have become a thing of the past. This has obviously had a knock on effect in reducing the number of homes bought and sold in the last decade. Buy how is the US market really doing? Not great if we look at some other numbers.
According to Zillow's data from last year, the total value of U.S owner-occupied housing remained at $3.2 trillion below 2006 levels. In addition, around 10 million households (or 20% of all mortgaged homes) are under water on their loans owing more on their mortgages than the market value of their homes. Many Americans continue to be at risk of foreclosure, joining five million other households that have suffered the same fate since the real estate market collapse in 2007.
With interest rates having been relatively low for a number of years now it has been cheaper to get into home loans, this might all be coming to and end if the Fed puts up rates as expected sooner or later.