
It’s Not To Early To Be Late

The golden rule of investing is buy low and sell high. While great advice, it is extremely difficult to accomplish with precision. Because of the perceived impossibility of timing peaks and troughs, many investment professionals prefer a buy and hold approach. They claim that, over time, stocks produce respectable average returns, so why attempt to pick peaks and troughs. We firmly disagree as taking a passive approach and riding the ups and downs in the market guarantees that investors will spend large periods of time recovering losses and not compounding wealth. Because of these losses, buy and hold portfolio returns usually fall far short of average market returns. For more on this reality, see the graph and article linked in the postscript below the article summary.
Prudent investment management argues that one should reduce risk when the market is not providing ample returns to take on risk and conversely one should assume more risk when the potential returns reward it. If an investor has $100,000 to invest, is he or she better served being fully invested in an index fund with that index valuation at or near all-time highs or being under-invested with a 30-40% allocation to cash? Cash may have a low return profile, but it bears no risk of loss and represents enormous opportunity at some point in the future. As we have stated before, risk is not a number produced by a formula or model; it is the exposure of hard-earned wealth to loss. Invested capital is always exposed to some level of risk, but an investor can decide whether the assumed risk is high or low. A passive approach surrenders all control over that important decision to the whims of the market.
Using various methods, one can establish that current valuations are indeed at or near all-time highs. In most cases the high water marks were established in 1929 or 1999. With the benefit of hindsight, every investor in those prior eras would have sold their stock allocations immediately, put their money in cash or bonds, and re-allocated back to equities when valuations normalized.
The benefit of hindsight is useful only to the extent that we are willing to heed the ample evidence of past cycles. Frederick the Great once said, “What is the good of experience if one does not reflect?” Given current equity valuations and their implied risk/return proposition, history is sending clear signals that investors should reduce their exposure to stocks and other risky assets.
This article looks back at 1929 and 1999 and analyzes how investors that sold several years ahead of the peaks fared. As you will see, an active approach to managing risk, even if very early and simple, can be much more rewarding than doing nothing.
**We selected the two time periods for comparison not because they represent the largest equity drawdowns in modern financial market history but because they had valuations most similar to today. Some will claim this approach to be fearmongering, but the fact is that valuations always revert to their mean over time. Assuming this time-tested, most basic law of finance is as true today as it has been throughout human history. 1929 and 1999 provide a comparable risk/return framework and important guidance for investors in 2018.
1999
Following a recession in late 1990 and the first half of 1991, the U.S. economy entered a ten-year stretch of continuous economic growth, the longest in modern history. During this period, the S&P 500 produced a total return of over 380% or about 20% annually. While the economy was humming along at a healthy pace, the growth of stock prices was not totally a function of economic and earnings growth. In fact, the bulk of the rise was due to a significant expansion in valuations. For example, had the cyclically-adjusted price-to-earnings (CAPE) ratio remained at its 1990 level of 17.05, which is similar to the long-term average, the S&P would have only risen about 75% and not 380%. The graph below charts the rise of the S&P 500 and CAPE from 1990 to its peak in 2000.
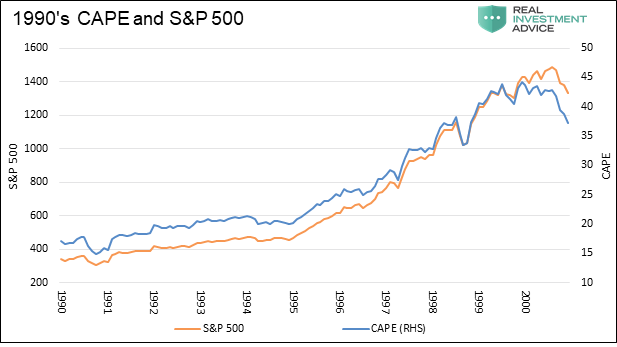
Data Courtesy: Robert J. Shiller
Now let’s consider how an active investor would have fared if they exited the stock market and bought bonds in August of 1997, three full years before the ultimate peak. We chose this point as CAPE, at that time registering 32.60, was the highest in recorded history, having just surpassed the level observed on the eve of the Great Depression.
The illustration below compares total returns from a portfolio that fully exited the stock market in August of 1997 and used the proceeds to buy a Ten-year U.S. Treasury bond versus a passive portfolio that remained in equities.
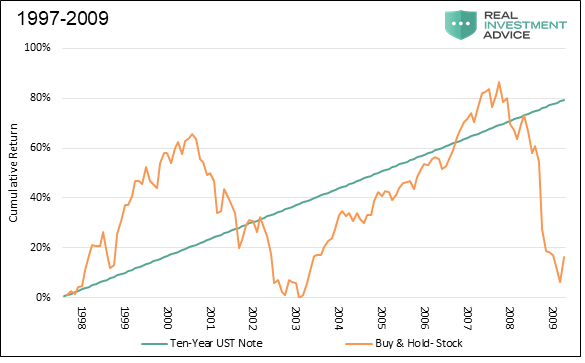
Data Courtesy: Robert J. Shiller
As shown, the active investor exhibited prudence, albeit three years too early. They forfeited over 60% of equity market gains from the remainder of 1997 through mid-2000. Despite foregoing these returns, the active portfolio’s cumulative returns far surpassed those of the passive investor once valuations reverted to their mean. In fact, the buy and hold portfolio had the same portfolio balance in 2003 as it did in 1997, despite receiving dividends from its equity positions throughout that period.
Following the three-year decline beginning in March 2000, an active investor would have likely reallocated in some proportion to stocks from bonds as valuations normalized. In this example, however, we keep the active portfolio in bonds to show how even the most basic, one-time act of active management can protect returns. By 2006, the passive portfolio returns once again surpassed those of the active portfolio. This outperformance lasted about two years, but the cumulative return on the passive portfolio would again fall to near zero in early 2009.
Needless to say, the passive investor had a wild ride but lost 12 years of time in which wealth could have compounded. The active investor that sold stocks and bought bonds three years too early certainly felt “seller’s remorse” during the last innings of the rally, but was likely gratified at their longer-term cumulative performance relative to the passive investor.
1929
From 1921 to 1929, the S&P 500 gained 485% or about 22% annually.Like the 1990’s, the growth of stock prices was not totally a function of economic and earnings growth. Had the cyclically-adjusted price-to-earnings (CAPE) ratio only risen to its long-term average of 16.87 as it was in 1927, the S&P 500 would have risen only about 260% during this period.
At the market peak in September of 1929, the CAPE valuation stood at 32.56, which is on par with the current CAPE.
To keep the 1929 analysis similar to the one performed above for 1999, we assume the active investor sold three years before the market top.
In this example, the active investor sold their stocks and bought a ten-year Treasury note in 1926. Similar to the late 1990’s, those three years would have been tough for our active investor to stomach. The graph below shows a nearly 150% rally in the S&P 500 in the three years leading to the market’s peak. Despite lagging by nearly 150% in the early-going, the active investor was ahead of the passive investor on a cumulative basis for the ensuing 23 years beginning in 1931.
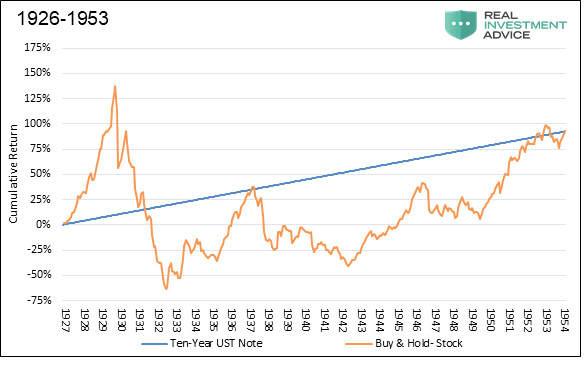
Data Courtesy: Robert J. Shiller
Again, if one were truly taking an active approach, the investor would have bought back stocks when CAPE reverted to its mean and cumulative returns would have further distanced themselves from the passive portfolio.
Summary
Since 2009, the S&P 500 has risen 412%. Like the 1920’s and 1990’s, much of the increase is based on massive valuation expansion and not fundamental strength in the economy or earnings. Similar to the two prior periods, this era will end with a reversion of valuations back to or below the mean.
The point of this analysis is that unless you are:
- Confident that you can call the top (no one can),
- Know when to get out (few actually do), and
- Importantly are willing to sell and forgo gains,
We suggest you begin to take precautionary actions today. This does not mean sell all of your stocks and buy bonds. It does mean you should actively manage your portfolio. As risks increase, both technically and fundamentally, allocate away from stocks. By taking this approach, an investor will avoid loses and have funds available which can be put to use when valuations normalize and prices are significantly lower.
We do not doubt that, if you take our advice today, you will be early and will leave some profits on the table. At the same time, it seems highly likely that your portfolio will be in much better shape over the course of the cycle.
The following wisdom of Howard Marks masterfully sums up our thoughts on “risk management”:
“If you refuse to fall into line in carefree markets like today's, it’s likely that, for a while, you’ll (a) lag in terms of return and (b) look like an old fogy. But neither of those is much of a price to pay if it means keeping your head (and capital) when others eventually lose theirs. In my experience, times of laxness have always been followed eventually by corrections in which penalties are imposed. It may not happen this time, but I’ll take that risk.”
Postscript: Difference Between Average and Actual Returns
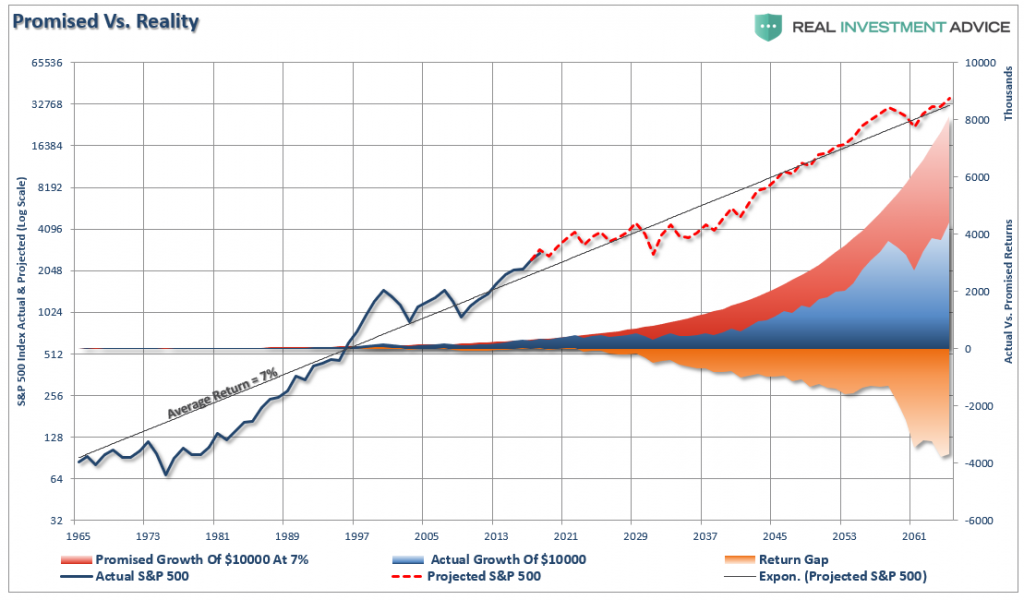
The following graph from The Myths of Stocks for the Long Run – Part IV, shows how volatility and drawdowns create a large gap between the average return (red area) and the real return (blue area) over a period.
(Click on image to enlarge)
Disclaimer: Click here to read the full disclaimer.


I liked the article. Marks is a great voice of reason and clarity in a frothy market like today’s. Of course, this type of thought process is really tricky for the average market participant, since many lack rigorous valuation skills, and invest by “feel”, backed with some basic math (PE ratios, and similar). The psychological pressure is also significant, since the next decline could still be many years away (as opposed to the example of someone who sold in 1997, when it was “only” three years).
I also wanted to point out that the current market seems different from the 1999 and 2006 markets. Both of those markets were marked by wild exuberance and rapacious pressure (tech and the mortgage push, respectively). Today’s market is definitely upbeat, but not wildly so. I’ve been waiting for the next decline, and holding cash (like many value investors), but it’s really unclear that there’s much fragility to this market. We’ll have to wait and see.
Any thoughts are welcome:).
Thanks for the article!