
Is Your Portfolio About To Burn To The Ground?
The economy is a forest. Individual stocks are like trees.
As in, “We can’t see the forest for the trees.”
Most of us focus on specific assets and the markets they inhabit. A basket of stocks in the S&P 500, for example.
There’s danger in that.
If you’ve chosen well, and your picks show nice returns, that hyperfocus might miss trends that say it’s time to run for cover.
Those trends show up in the real-world economy before they affect stock markets. But warning signs exist even in stock markets… if you know to look for them.
I looked… and those warning signs are flashing fire-engine red. Learning to interpret them could help your portfolio survive the next recessionary fire.
Dude, Where’s My Profit?
Let’s start with an indicator that reveals what’s going on in the “real” economy of physical goods and nonfinancial services. It leaves out the FIRE sector (finance, insurance, and real estate).
Gross value added of nonfinancial companies after inflation measures the net value of goods and services produced after adjusting for production costs.
When it’s negative, it means companies aren’t making money from selling their wares. If they’re showing profits in their quarterly reports, it’s coming from somewhere else — cost-cutting, layoffs, asset sales and so on. Those aren’t sustainable.
Moreover, whenever this indicator falls below zero on a year-on-year basis, the U.S. economy enters a recession — every single time:
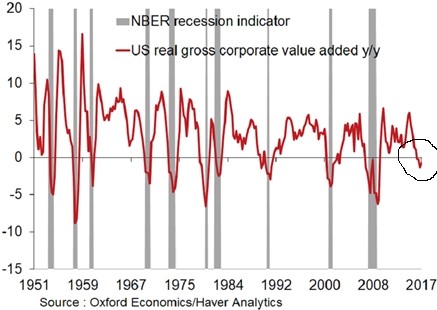
This measure just turned negative. Why should this time be any different?
The Slinky Cycle
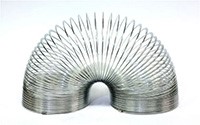
Think of the economy and its business cycle as a compression wave — a Slinky, for example.
As economic activity increases, firms make more profit. They use that profit to invest in new productive capacity, hire workers and grow.
That spending ripples out through the economy, as workers spend wages and producers of capital goods expand their own operations, and so on.
Eventually, however, that expansionary wave slows down as markets become saturated. Profits start to fall — as in the chart above — and companies cut back on investment, jobs and expansion plans. That also ripples through the economy.
The Slinky contracts.
Given this expansion/contraction dynamic in the economy, we can use changes in pre-tax profit margins over time to get a sense of where we are in the business cycle.
As the following chart shows, profits tend to rise at a steady rate, level off, then fall, signaling a looming recession. The U.S. is now in the mature stage of the cycle — roughly 80% of the way to recessionary conditions:
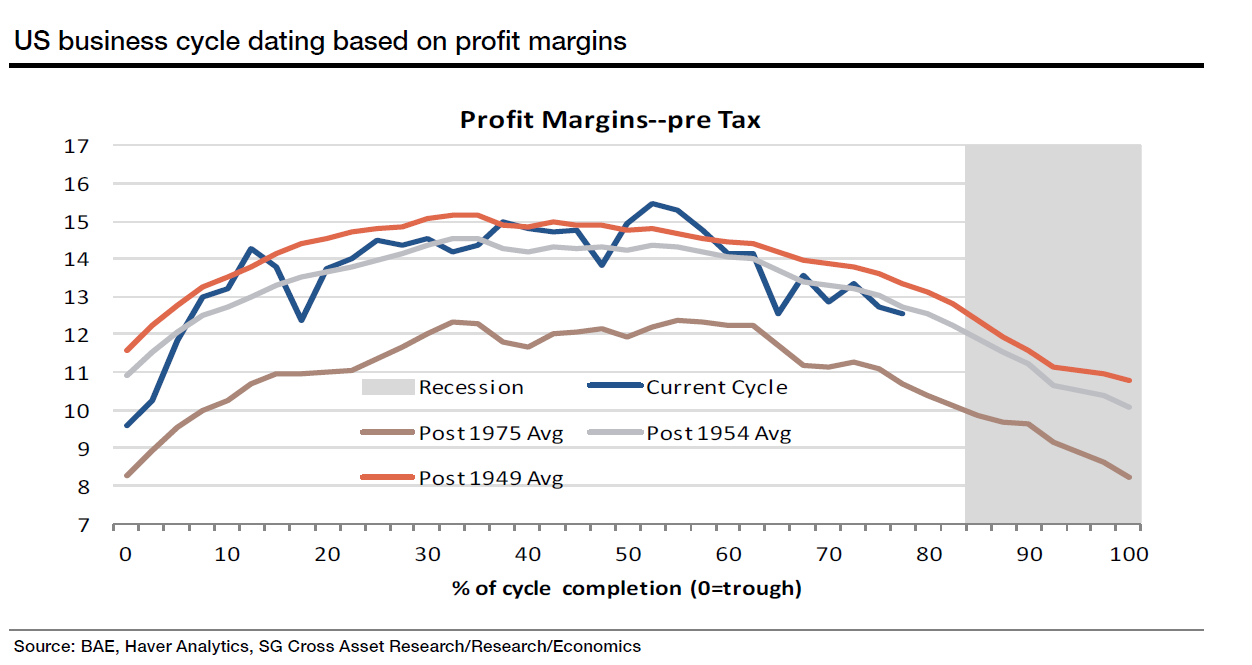
This pattern has held true for every recession since 1949. Why should this time be any different?
Chasing Unicorns
When the business cycle is petering out, sending us into the contraction phase, the degree of correlation within and between price movements of various asset classes — such as stocks, bonds, and commodities — begins to decline.
Asset prices that usually move together start to move independently. Oil futures drop but retail sector stocks rise, for example. Transport stocks suffer but some automakers do well.
Why is this?
When there’s a bear market, investors tend to be conservative. It’s too risky to go chasing after individual stocks, even if analysts like them.
For example, if Firm A and Firm B are in the same industry, there’s no reason why one of them should perform better than the other in the short term if market conditions for each are identically weak.
Sure, some firms have great innovations and break free from the pack.
But cautious investors are much less likely to support such stocks in a bear market, where preserving capital is key. For that reason, correlation tends to be higher in a bear market.
By contrast, correlation tends to fall during the final stages of a bull market, as stock pickers chase individual stocks that report superior results, even as the rest of the market declines.
For example, Atmos Energy Corp. (NYSE: ATO), a Texas natural gas distributor/pipeline company, is soaring even though the natural gas sector is in dire straits.
Recently, the Chicago Board of Exchange’s Implied Correlation Index for the S&P 500 (JCJ) has plummeted… just as it did in 2008 and late 2014, just before the big drop in January 2015:
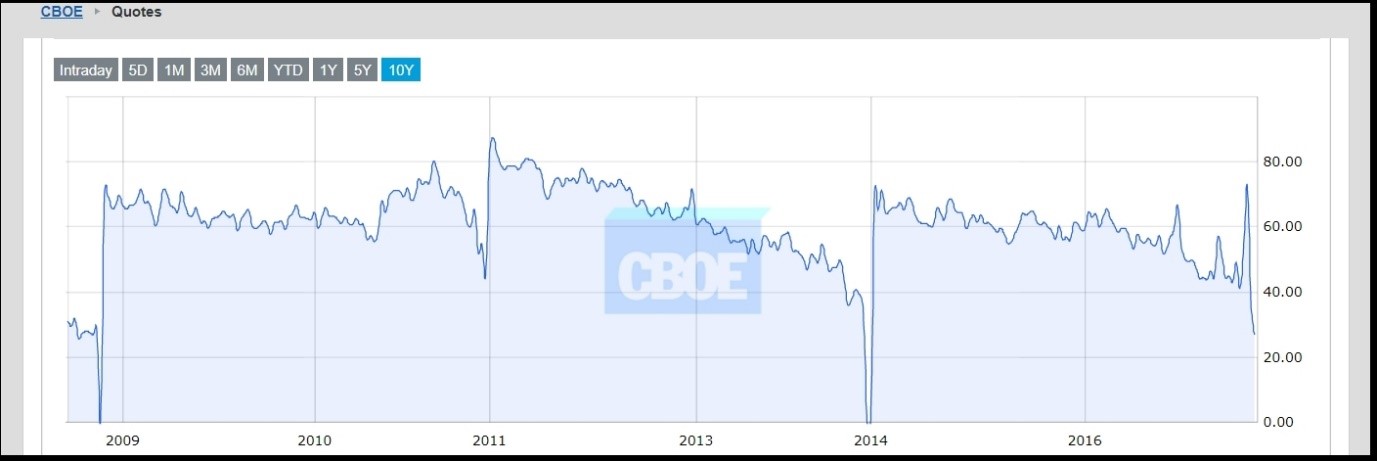
This isn’t just a U.S. phenomenon. In a note published earlier this week, Morgan Stanley notes that assets across the world are the least correlated in almost a decade.
Thinning the Herd
A fall in correlation is due in part to the fact that as a business cycle nears its end, fewer firms remain profitable. This can happen even if the market is still rising, but driven by a few big stocks or sectors.
That’s happening right now. Fewer and fewer U.S. stocks have been rising with the market as it reaches new highs.
The gap between the overall market index and a measure of the proportion of stocks that are trading below their 200-day moving average — only 57% — is disturbingly wide (the red line):
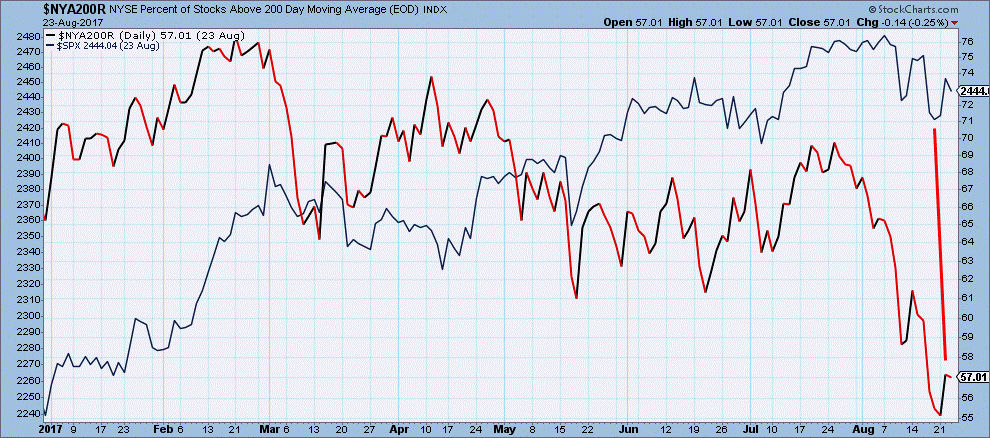
To me, that suggests a business cycle on its last legs.
Here’s the thing about forests and trees.
A big tree in the middle of the forest has no idea a fire is raging on the edge of that forest. The big tree is growing well, thriving, secure… until the fire arrives and burns it to the ground.
There was nothing wrong with the tree… but it still went down with the forest around it.
As the business cycle winds down, which stocks will be like that big tree in the forest?


The cycle is old, everyone knows it. It was artificially supported by artificially low interest rates, then QE, and now by dollar devaluation. I figure it will hold out this year. I would play this by investing in companies that reap bigger incomes from overseas sales as the dollar declines or by investing in healthy companies that are growing and don't need to raise more money (hopefully close to debt free). Sadly there are 2 other things supporting the market. Decreases in share counts by buyouts and corporate buybacks fueled with debt making it harder to find low debt load companies. And higher dividends and debt fueling unsustainable growth and valuations. It is uncertain how long this mix will last. The longer it does the weaker the US gets because money that used to go to working capital and capital investment is no longer going there.
You can blame foreign trade or anything else, however, our broken monetary system that is distorting the free market is what is encouraging bad short term decisions and leading us into a forest filled with loins,tigers, and a giant bear.