
Is The Value Style Really In Favor Now?
It seems as though I have written a dozen or more articles on the value versus growth style during the current economic cycle. The extent to which growth has dominated has certainly been a little surprising. For most of the equity market's upward move since the bottom of the financial crisis, the growth style of investment has dominated as seen in the below chart.
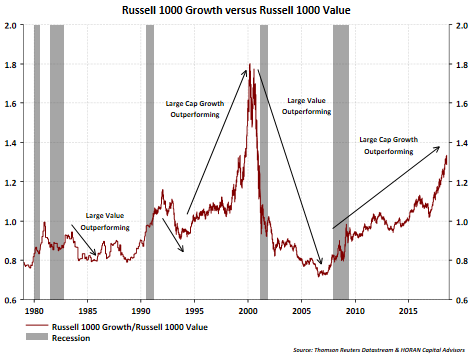
In looking at a shorter time period though, there have been brief spurts of outperformance for value as seen below. The yellow shading at the end of the below chart represents mostly the month of July and is this the real turn away from growth and into value style stock outperformance?

What gives me pause is the fact history has mostly supported value outperformance coming out of a recession. Late in an economic cycle growth tends to dominate performance as growth-type companies tend to grow earnings in spite of the economy. In 2014 I wrote a value/growth article and included the below commentary from David Kovacs, CFA, who wrote a white paper, Forecasting Performance Cycles of Value and Growth Stocks in Global Equity Markets, which he distinctly notes when growth tends to be in favor versus value and vice versa.
"Following periods when short-term rates ease, lending activity and subsequently business development typically accelerate. During these periods value stocks, led by financial and industrial companies, begin to outperform. As the global economy begins to expand, demand for basic materials, such as metals, and energy related commodities, such as oil and natural gas, rises. That leads to an increase in the price of these commodities which in turn has historically led to the outperformance of the stocks of commodity producers and processors."
"As in the case of an economic slowdown, the monetary response to economic expansion is also typically delayed until sustained signs of acceleration in inflation are apparent. In response, central banks begin to hike short-term interest rates to the point where the interest rate yield curve is flat or inverted, i.e. short-term rates are either equal to or higher than long-term rates. Lending activity to businesses then typically slows significantly, profits of financial institutions decline, and financial stock prices begin to lag the market averages. Economic activity moderates, and once again those stocks that can grow their earnings at the fastest pace, namely, growth stocks, typically resume a period of multi-year outperformance."
One area of the market that has certainly contributed to equity returns is the FAANG group of stocks, i.e., Facebook, Apple, Amazon, Netflix and Google (now Alphabet). The recent performance of this basket has not been strong. The below chart shows the average return of this basket versus the S&P 500 Index over the past two months. In less than a week, the FAANG's are down almost 10%.

The below chart compares the return of the FAANG basket to the S&P 500 Index over a longer five year time period. If the gap does close how will it occur, outperformance of the S&P 500 Index or further pullback in the FAANG's?

It certainly feels late in the economic cycle; however, the economic data continues to support further expansion. Company bottom line earnings and top-line sales results remain strong. Also, The Tax Cut and Jobs Act may be having the result of extending the current cycle. This being the case, the equity market could be seeing a rotation into value style equities that is commensurate with a pickup in economic growth. During this business cycle though, the outperformance of value has not lasted much longer than a year or so and this cycle being stretched, value's outperformance may be short-lived again.
Disclosure: None.


