
Is The US Stock Market Topping?
Here is the chart of the week:
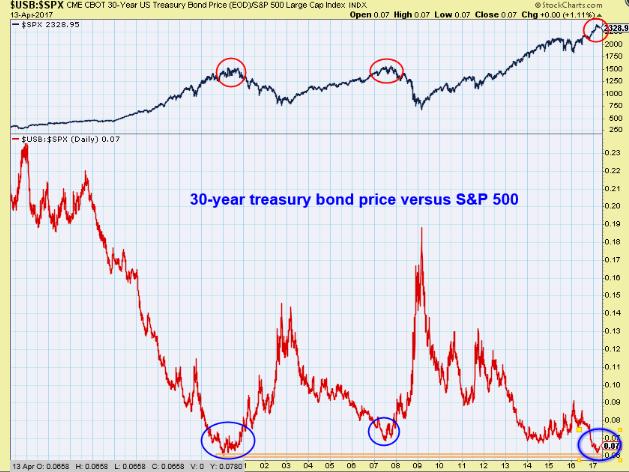
source: stockcharts.com
The chart shows the 30-year treasury bond price to S&P 500 ratio. The blue circles show cyclical lows of this ratio. Note that these lows correlate with the tops printed by the US stock market (red circles), represented by the S&P 500 index. The one-million-dollar question is:
Is the US stock market topping now?
Disclaimer: This article is not an investment advice. I am not a registered investment advisor. Under no circumstances should any content from here be used or interpreted as a recommendation for ...
more
How did you like this article? Let us know so we can better customize your reading experience.

Comments
Leave a comment to automatically be entered into
our contest to win a free Echo Show.

