
Is Bubble Risk Elevated For US Stocks?
The US stock market reached a new record high yesterday (Feb. 13) via several benchmarks, including the S&P 500. Analysts say that the crowd is enthused by bullish expectations for the Trump administration’s economic plan in general, and a tax overhaul in particular for the immediate future.
“The market is going on the optimism of the Trump tax plan that will be announced soon,” Robert Pavlik, chief market strategist at Boston Private Wealth, tells CNBC. “This is very good news for the market.”
There’s also a growing sense that a new era that favors corporate America is dawning in the US. “Day after day, corporate executives from a variety of industries are being brought to the White House to consult with the president,” says Jamie Cox, managing partner of Harris Financial Group via Reuters. “Business does seem to be back in the driver’s seat, and I think that’s why people are willing to pay up a little bit more for stocks.”
The reasoning is that Trump’s policy agenda to cut taxes and regulation and roll out a massive infrastructure spending plan will raise economic growth. The question is whether expectations in the market have run ahead of reality? To put it another way, has all the good news been priced into the market? Or has the fun just started?
The answer depends on who’s dispensing the analysis. By some accounts, trouble is just around the corner. “The US stock market at this level reflects a combination of great demand, great complacency, and great greed,” warns Mark D. Cook of The Mark D. Cook Advisory Service. In an piece for MarketWatch.com published on Monday, he asserts that “stocks are clearly in a bubble, and like all bubbles, this one is about to burst.”
Is there any hard data support for thinking so? In search of an answer we can start by looking at the Professor Robert Shiller’s market valuation estimate – the Cyclically Adjusted Price Earnings Ratio, or CAPE. Stocks don’t look cheap, according to this measure, but valuation is still well below extreme, based on the historical record over the last 20 years. The current reading of 28.66 looks middling when we restrict our rear view mirror to data from 1997 on. But the same valuation looks worrisome in context with the full history of the data that goes back to the last-19th century.
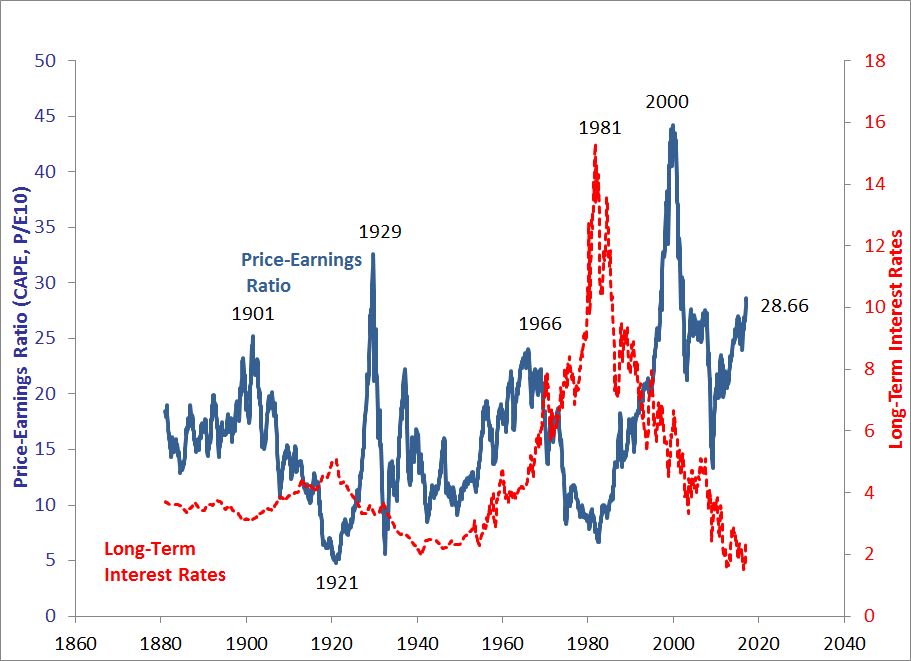
Using CAPE for tactical asset allocation purposes, however, is a risky affair, as a number of analysts have noted over the years. For example, financial planning guru Michael Kitces advises that CAPE is “terrible for market timing, but valuable for long-term retirement planning.”
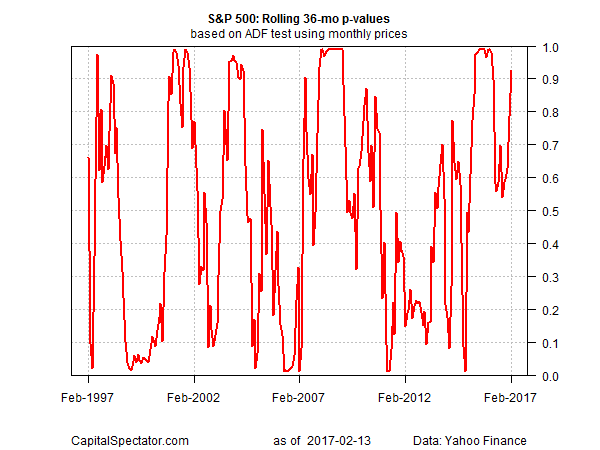
For another perspective on bubble risk, let’s turn to an econometric technique that attempts to quantify irrational exuberance. The methodology tests for a unit root in a time series to identify periods when the data becomes non-stationary and exhibits non-random and perhaps explosive behavior in a statistical sense — i.e., when the numbers look bubbly. For the details, see this post from 2014.
There are several possibilities for estimating bubble risk through a relatively objective lens. All the usual caveats apply, however, for the usual reason: the future’s uncertain and defining bubbles is a slippery fish. As an added complication, the market can remain irrational for far longer than you can stay solvent and no amount of number crunching can change this simple fact. That said, it’s useful to keep an eye on bubble risk from several perspectives, one of which is profiled below.
To cut to the chase, the Augmented Dickey-Fuller Test for the S&P 500 is currently signaling that bubble risk is elevated. Based on a rolling 36-month window for p-values, the current reading is in nose-bleed territory: roughly 0.93. The last time this metric initially rose to that level (June 2015) the S&P 500 was near a top. In early April 2015, I previewed that possibility. Two months later, in August, the S&P entered a rough period (arguably a bear market) that would eventually cut the index by more than 10% by February 2016. It’s also worth noting that readings above 0.9 preceded the 2008 crash.
It could be different this time, of course. In contrast with 2015, for instance, the market is currently supported by expectations that the economy is poised to expand at a materially faster pace due to a change in the political power structure in Washington. As such, the question for investors can be summed up as: Will politics triumph?
Perhaps. Meantime, the chart above implies that the expected return for the equity market in the near term looks challenged. Granted, the market could continue to rally. But if you’re inclined to consider probabilities as an input for risk management, there’s a case for a degree of de-risking.
Should you sell everything and go to cash? No, of course not. That’s almost never a good idea. But if you’re sitting on healthy gains in your US equity allocation, and the recommendation to buy low and sell high resonates as wisdom, let’s just say that when the market’s priced for perfection it’s not too early to think about taking some profits and paring back risk exposure.
Disclosure: None.


