
Irrational Lugubriousness On Inflation
Yesterday the 1-year CPI swap rate closed at 1.77%, the highest rate since 2014 (see chart, source Bloomberg).

The CPI swap (which, as an aside, is a better indicator of expected inflation than are breakevens, for technical reasons discussed here for people who truly have insomnia) indicates that headline inflation is expected to be about 1.77% over the next year. That’s nearly double the current headline inflation rate, but well below the Fed’s target of roughly 2.3% on a CPI basis. But at least on appearances, investors seem to be adjusting to the reality that inflation is headed higher.
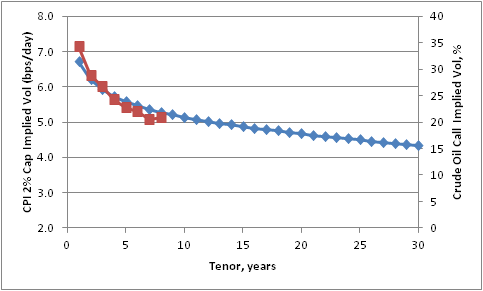
Unfortunately, appearances can be deceiving. And in this case, they are. The headline inflation rate is of course the combination of core inflation plus food inflation and energy inflation; as a practical matter most of the volatility in the headline rate comes from the volatility endemic in energy markets. I’ve observed before that this leads to unreasonable volatility in long-term inflation expectations, but in short-term inflation expectations it makes perfect sense that they ought to be significantly driven by expectations for energy prices. The market recognizes that energy is the source of inflation volatility over the near-term, which is why the volatility curve for inflation options looks strikingly like the volatility curve for crude oil options and not at all like the volatility curve for LIBOR (see chart, source Enduring Investments).
The shape of the energy futures curves themselves also tell us what amount of energy price change we should include in our estimate of future headline inflation (or, alternatively, what energy price change we can hedge out to arrive at the market’s implied bet on core inflation). I am illustrating this next point with the crude oil futures curve because it doesn’t have the wild oscillations that the gasoline futures curve has, but in practice we use the gasoline futures since that is closer to the actual consumption item that drives the core-headline difference. Here is the contract chart for crude oil (Source: Bloomberg):

So, coarsely, the futures curve implies that crude oil is expected to rise about $4, or about 9%, over the next year. This will add a little bit to core inflation to give us a higher headline rate than the core inflation rate. Obviously, that might not happen, but the point is that it is (coarsely) arbitrageable so we can use this argument to back into what the market’s perception of forward core inflation is.
And the upshot is that even though 1-year CPI swaps are at the highest level since 2014, the implied core inflation rate has been steadily falling. Put another way, the rise in short inflation swaps has been less than the rally in energy would suggest it should have been. The chart below shows both of these series (source: Enduring Investments).

So – while breakevens and inflation swaps have been rallying, in fact this rally is actually weaker than it should have been, given what has been happening in energy markets. Investors, in short, are still irrationally lugubrious about the outlook for price pressures in the US over the next few years. Remember, core CPI right now is 2.2%. How likely is it to decelerate 1.5% or more over the next twelve months?
Disclaimer: You can (and should!) follow me @inflation_guy or sign up for email updates to my occasional articles more


