
Investors Remain Cautious As Trump Meets Unexpected
On Tuesday, March 21, the S&P 500 had its first 1%+ down-day of the year, and its first truly significant downward move in five months, falling -1.3% for the day, while the Russell 2000 small caps fell by an ominous -2.7%. For the S&P, it was the culmination of a -2.2% move over a 4-day period before stabilizing for a few days. But for the Dow, Monday of this week was its eighth straight losing day for the first time – its longest losing streak since 2011. The consensus bogeyman of course is the elusive passage of a new healthcare reconciliation bill and the fear that this exposes chinks in President’s Trump’s armor that may foreshadow delays in all his other fiscal stimulus proposals that have been so widely anticipated, and largely priced in. But I suggest focusing on the fundamental economic trends that are still solidly in place and not jump to conclusions about the future of external stimuli, some of which should enjoy broader bipartisan support. Maybe this is why the VIX has held defiantly below the important 15.0 level.
In this periodic update, I give my view of the current market environment, offer a technical analysis of the S&P 500 chart, review Sabrient’s weekly fundamentals-based SectorCast rankings of the ten U.S. business sectors, and then offer up some actionable ETF trading ideas. Overall, our sector rankings still look bullish, and the sector rotation model continues to suggest a bullish stance. Read on....
Market overview:
Stocks continue to retrench, consolidate, and test key support levels after running into a brick wall on March 1 at Dow 21,000, S&P 500 2,400, NASDAQ 5,900, and Russell 2000 1,400, as investors seem to be taking a cautious but still hopeful wait-and-see approach. Those same major indexes closed Monday at 20,551; 2,342; 5,840; and 1,357; respectively, but under the hood Monday served up a nice intraday recovery off of a politics-driven weak start to the day, including a successful (and perhaps overdue) test of the 50-day simple moving average. Given that US equity valuations have been bid up at least partly in anticipation of Trump’s fiscal stimulus, investors understandably are awaiting some positive signals of progress in the President’s aggressive agenda. Still, year to date, the S&P 500 is up about +4.6%, and fundamentals are strong.
The Technology sector has been strong, up about +11% YTD, as you might expect for a sector that contributes to growth in all other sectors while avoiding the unfortunate politics others must endure. Despite the ongoing political rancor around the Healthcare sector, it continues to hold up well this year, especially the medical device and biotech segments. Homebuilders are also looking strong as housing prices are holding up, inventories are tight, and the NAHB confidence index hit its highest level (71) since mid-2005.
On the flip side, Energy has been the worst performer so far this year, down about -10% YTD. In addition, transports and financials have become distressingly weak this month. After hitting a high on March 1, the Dow Jones Transportation Average is down about -5% this month through Friday as it becomes increasingly apparent that Trump won’t be steamrolling his stimulus programs through Congress. Likewise, the financial sector of the S&P 500 is -4.3% so far this month. These no doubt are important sectors for accelerated growth in the broad economy, so they will need to get back onboard soon.
Of course, everyone knew Trump would find zero support from across the aisle, which is fully dug-in to ensure he fails miserably. But the harsher reality is that even building consensus within his Republican party is going to be problematic for this political outsider. In fact, I’m perplexed as to why Speaker Ryan would schedule a vote and encourage the President to use up valuable political capital to support the draft bill if he didn’t yet have sufficient votes already lined up. After all, members of the GOP wear many stripes, variously identifying as Traditionalist, Neoconservative, Moderate, Liberty Caucus, Freedom Caucus, compassionate conservatives, Tea Party, Libertarian, and Christian Right, among others. But after having eight years to concoct the most perfect plan imaginable, fully vetted by all factions of the party in both houses of Congress, it’s frankly hard to understand. Not even the chair of the House Appropriations Committee was onboard. It’s clear that while Republicans have a majority, they haven’t yet formed a cohesive “governing majority.”
However, my view is that it is better to delay a new bill and get it right rather than merely replace one set of problems with another. But in any case, Republicans and Democrats alike should be advised not to forget that voters from across the political spectrum gave massive support to two populist candidates – Trump and Sanders – who promised to shake up business as usual in Washington. So, Republicans had better not blow their opportunity or voters might give the socialist version of populism a try the next time around. Trump’s entire agenda – comprising tax & regulatory reform, infrastructure & defense spending, and shoring up of ill-functioning healthcare, schools, borders, trade deals, and inner cities (while slashing spending in areas where the Federal government doesn’t belong) – depends upon it.
Nevertheless, I think the failure (so far) to pass a healthcare reconciliation bill will not prevent the administration from bringing forth a tax reform budget reconciliation in time for the 2018 fiscal year (which commences in October 2017). Even if not all Republican members of congress agree with the tax bill, something is better than nothing in this area. In any case, I think that after the initial market euphoria from having the election uncertainty resolved (no matter who came out on top), plus perhaps a bit more of a rally on the expectation of Trump’s fiscal stimulus (especially in small caps), the sustained market strength is more about actual earnings reports, real economic growth, and global disinflation successfully transitioning to reflation, rather than being built solely on hope related to Trump’s agenda. Otherwise, this setback would have sent stocks reeling.
But given that valuation multiples are elevated, further upside will continue to rely on improving guidance for capex, sales, and EPS. So far, Wall Street has been reluctant to boost its projections too much, while investors have been more optimistic, so eventually one or the other is going to have to change – i.e., either the analyst community will begin to revise upwards in greater earnest or investors will take some money off the table – until actual results show marked improvement.
On the energy front, President Trump has approved the Keystone pipeline project, while US drillers weekly rig count increased by +21 to reach 652, versus 372 in March 2016. That’s a 75% increase. Thus, despite the fact that the OPEC deal hasn’t crumbled, US oil prices have fallen below $50 as rising inventories (albeit based on backward-looking data) have offset cuts from other producing nations and futures traders have been unwinding their record levels of long positions. Now, OPEC, Russia, and other producers are considering whether to prolong their production cuts, which expire at the end of June. Nevertheless, I think there’s a good chance that as summer driving season arrives, demand will rise such that oil will be back above $50.
Looking ahead, global economic fundamentals should continue to encourage investors to hold higher levels of risk assets, including equities. Here at home, the economy has continued to expand, inflation is still quite low, interest rates remain near historic lows, and consumer confidence tracks near record highs. And when you consider the very real expectation of tax and regulatory reform in the not-too-distant future, it seems unlikely that stocks will sell off in a big way, despite the healthcare setback and elevated valuation multiples.
As you know, two weeks ago, the FOMC raised the fed funds rate another 25 bps, but also suggested that 2% is not a hard ceiling on inflation. In other words, Yellen does not intend to be an “inflation hawk,” but instead will remain accommodative (i.e., dovish) while taking care not to undermine stocks or fragile economic growth. After all, the prospect of stronger economic growth implies higher return on capital, which encourages companies to invest idle cash in their businesses rather than just in share buybacks (which artificially enhance EPS).
The 10-year Treasury closed Monday at 2.37%. (As a reminder, it closed 2016 at 2.45%.) The 30-year closed Monday at 2.98%. On the short end of the yield curve, the 2-year closed at 1.25% and the 5-year at 1.91%. The spread between the 10-year and 2-year flattened further to 112 bps, while the spread between the 30-year and 5-year fell to 107 bps. It is evident to me that global investors are still seeking the safety and relatively higher returns of US Treasuries on the “carry trade,” while speculators continue to cover their shorts in bonds. CME fed funds futures now place the odds of the next rate hike at 48.5% in June, 56% by July, and 70% by September (and a 24% chance of two hikes by then). By December, there is now an 85.5% chance of at least one more rate hike, 49% of two or more, and 16% odds of three or more.
The CBOE Market Volatility Index (VIX ), aka fear gauge, closed Monday at 12.50 and has held defiantly below the 15.0 threshold between complacency and fear ever since the election – which has now exceeded 4.5 months.
This week brings lots of new economic reports, including Case-Shiller home price index and Conference Board consumer confidence on Tuesday, the third estimate of Q4 GDP, personal consumption, and initial jobless claims on Thursday, and personal income, personal spending, personal consumption expenditures, Chicago PMI, and U. of Michigan consumer sentiment. As of last Friday, the Atlanta Fed’s GDPNow model forecast for real GDP growth (seasonally adjusted annual rate) in Q1 2017 came in at 1.0%, which compares to 1.8% on March 1 and 2.5% on February 27. The next update will be this Friday.
I am eager to see how US employment and the trend in labor participation are progressing. Recall that in February, the employment-to-population ratio rose to 60%, the highest since February 2009, while the labor force participation rate rose in February to 63%, the highest since March 2014. Among the so-called “prime-age workers” (ages 25-54), participation rose to 82% in February, which is the highest since 2011. It is evident that improving sentiment and a resurgence in wage growth (+2.8% year-over-year in February) have played important roles in attracting people back into the workforce.
As investors have shifted from a high-correlation, risk-on/risk-off trading mentality to a lower-correlation, higher-dispersion stock-pickers mindset, active management has shown signs of working again. However, one uncertain impact on stock-picking and active management is the rise in ETF trading. As the number of listed equities has fallen through the years while the number of ETFs has exploded, ETFs now make up about 15% of the number of listings on US exchanges, but they account for over 30% of dollar trading volume and 20% of share trading volume. Moreover, just 20 of the largest (mostly pure-beta) ETFs account for 90% of the ETF trading volume. Much of this volume is institutional hedging and short-term trading exposure. But for the foreseeable future, I think there will continue to be an opportunity for savvy stock pickers to outperform the broad indexes, despite the rapid growth of these passive investing vehicles.
Of course, I will continue to remind you that the upward trend in US equities will not be a straight line, and volatility likely will reassert itself at some point – perhaps soon. In fact, I think a nasty selloff is to be expected at some point this year. But if and when it happens, I recommend not to panic. Because unless it results from a game-changing “Black Swan” event that sends the global economy into turmoil, an irrational selling event may be the welcome buying opportunity we all hope for.
SPY chart review:
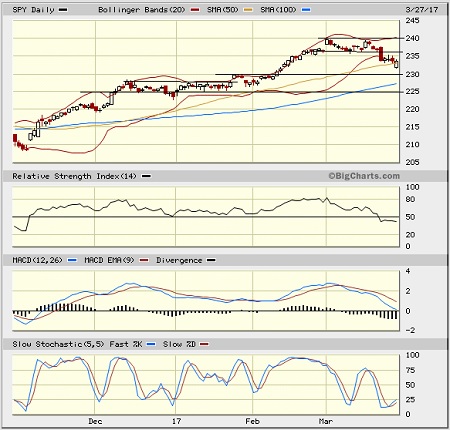
The SPY closed Monday at 233.62 after recovering from what started out looking like “the next leg down.” March has shaped up as a month for an orderly correction to the 4-month post-election rally. It was election day when SPY last closed below its 50-day simple moving average – and Monday looked like the day it would finally do so before staging a solid recovery. Up until last Tuesday when SPY fell -1.3%, the 20-day simple moving average had been providing reliable support ever since the election. Now SPY is trying valiantly to hold support at its 50-day SMA. Bollinger Bands had pinched together as it formed the 236-240 sideways consolidation channel between March 1 and March 20, so a move one way or the other was in the cards. As it turned out, it was down. If it falls further, next support levels include prior resistance at 230, the 100-day SMA now approaching 227, a previous breakout level at 225, and the critical 200-day (approaching 221). The 20-day SMA is now pointing down, and I would hate to see it cross downward through the 50-day as the 50-day flattens out. On the other hand, oscillators MACD and Slow Stochastic are both trying to turn up from oversold territory. Overall, the technical picture is a little cloudy at the moment.
Latest sector rankings:
Relative sector rankings are based on our proprietary SectorCast model, which builds a composite profile of each of over 600 equity ETFs based on bottom-up aggregate scoring of the constituent stocks. The Outlook Score employs a forward-looking, fundamentals-based multifactor algorithm considering forward valuation, historical and projected earnings growth, the dynamics of Wall Street analysts’ consensus earnings estimates and recent revisions (up or down), quality and sustainability of reported earnings (forensic accounting), and various return ratios. It helps us predict relative performance over the next 1-3 months.
In addition, SectorCast computes a Bull Score and Bear Score for each ETF based on recent price behavior of the constituent stocks on particularly strong and weak market days. High Bull score indicates that stocks within the ETF recently have tended toward relative outperformance when the market is strong, while a high Bear score indicates that stocks within the ETF have tended to hold up relatively well (i.e., safe havens) when the market is weak.
Outlook score is forward-looking while Bull and Bear are backward-looking. As a group, these three scores can be helpful for positioning a portfolio for a given set of anticipated market conditions. Of course, each ETF holds a unique portfolio of stocks and position weights, so the sectors represented will score differently depending upon which set of ETFs is used. We use the iShares that represent the ten major U.S. business sectors: Financial (IYF), Technology (IYW), Industrial (IYJ), Healthcare (IYH ), Consumer Goods (IYK), Consumer Services (IYC), Energy (IYE), Basic Materials (IYM), Telecommunications (IYZ), and Utilities (IDU). Whereas the Select Sector SPDRs only contain stocks from the S&P 500, I prefer the iShares for their larger universe and broader diversity.
Here are some of my observations on this week’s scores:
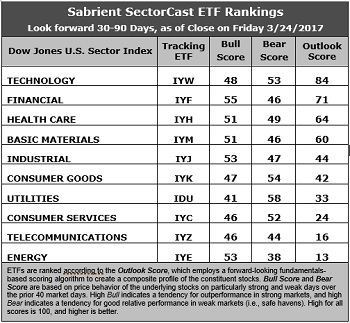
1. Technology once again retains the top spot with an Outlook score of 84. In aggregate, stocks within the sector display the best Wall Street sell-side analyst sentiment (i.e., net positive revisions to EPS estimates), the highest return ratios, a reasonable forward P/E of about 17.5x, a strong forward long-term EPS growth rate of 13.1%/yr, and a low forward PEG of 1.34 (ratio of forward P/E to forward EPS growth rate). In second again this week is Financial with an Outlook score of 71. It has the second lowest forward P/E of 16.6x and the best insider sentiment (net open market buying). Healthcare has moved back up to third at 64, followed closely by Basic Materials at 60. Notably, Healthcare displays the lowest forward P/E of 15.9x as uncertainty around the sector has held it back. Rounding out the top five is Industrial, and it’s worth noting that these five sectors all have net positive revisions to EPS estimates, while the bottom five all have net negative revisions.
2. Energy and Telecom remain in the bottom two with Outlook scores of 13 and 16. Telecom displays the weakest insider sentiment (net open market buying) and analyst sentiment (i.e., net negative earnings revisions), as well as the second highest forward P/E of 24.7x and the second highest (next to Utilities) forward PEG of 2.38. Energy has tumbled back down to the bottom of the rankings by displaying generally mediocre factor scores across the board, including the worst return ratios and the highest forward P/E of 28.6x, although it also boasts the highest year-over-year forward EPS growth rate (23.9%) and the lowest forward PEG (1.19).
3. Looking at the Bull scores, Financial boasts the top score of 55, as it has displayed relative strength on strong market days, while Utilities is the lowest at 41. The top-bottom spread has dropped to 14 points, which reflects moderately high sector correlations on strong market days, which is not so favorable for stock picking. It is desirable in a healthy market to see low correlations reflected in a top-bottom spread of at least 20 points, which indicates that investors have clear preferences in the market segments and stocks they want to hold (rather than broad risk-on behavior).
4. Looking at the Bear scores, we find Utilities at the top with a score of 54, which means that stocks within this sector have been the preferred safe havens lately on weak market days. Energy scores the lowest at 38, as investors have fled during market weakness. The top-bottom spread is 16 points, which reflects moderate sector correlations on weak market days. Ideally, certain sectors will hold up relatively well while others are selling off (rather than broad risk-off behavior), so it is desirable in a healthy market to see low correlations reflected in a top-bottom spread of at least 20 points.
5. Technology displays the best all-around combination of Outlook/Bull/Bear scores, while Energy is the worst. Looking at just the Bull/Bear combination, there is a 3-way tie among Technology, Financial, and Consumer Goods (Staples/Noncyclical), indicating superior relative performance (on average) in extreme market conditions (whether bullish or bearish), while Telecom is the worst.
6. This week’s fundamentals-based Outlook rankings look solidly bullish to me, given that the top five sectors are economically-sensitive or all-weather (Technology, Financial, Healthcare, Materials, and Industrial). Keep in mind, the Outlook Rank does not include timing, momentum, or relative strength factors, but rather reflects the consensus fundamental expectations at a given point in time for individual stocks, aggregated by sector.
ETF Trading Ideas:
Our Sector Rotation model, which appropriately weights Outlook, Bull, and Bear scores in accordance with the overall market’s prevailing trend (bullish, neutral, or defensive), still displays (just barely) a bullish bias and suggests holding Financial (IYF), Healthcare (IYH), and Industrial (IYJ), in that order. (Note: In this model, we consider the bias to be bullish from a rules-based trend-following standpoint when SPY is above both its 50-day and 200-day simple moving averages on the rebalance day.)
Besides iShares’ IYF, IYH, and IYJ, other highly-ranked ETFs in our SectorCast model (which scores over 600 US-listed equity ETFs) from the Financial, Healthcare, and Industrial sectors include PowerShares KBW Bank Portfolio (KBWB), SPDR S&P Pharmaceuticals ETF (XPH), and VanEck Vectors Steel ETF (SLX).
If you prefer a neutral bias, the Sector Rotation model suggests holding Technology, Financial, and Healthcare, in that order. On the other hand, if you are more comfortable with a defensive stance on the market, the model suggests holding Technology, Utilities, and Consumer Goods (Staples/Noncyclical), in that order.
By the way, an assortment of other unique ETFs that happen to score well in our latest rankings include VanEck Vectors Mortgage REIT Income (MORT), iShares PHLX Semiconductor ETF (SOXX), VanEck Vectors BDC Income ETF (BIZD), First Trust NASDAQ-100 Tech Sector Index Fund (QTEC), US Global Jets ETF (JETS), iShares US Home Construction ETF (ITB), First Trust Technology AlphaDEX Fund (FXL), and AlphaMark Actively Managed Small Cap ETF (SMCP).
Disclosure: The author has no positions ...
more

