
Investors Make Up New Rules For Their New Market Paradigm
Investors in U.S. equities seem to have embraced a new market paradigm in which upside spikes come more swiftly than the downside selloffs. Remember when it used to be the other way around? When fear was stronger than greed? The market is consolidating its gains off the early-October V-bottom reversal, and no one seems to be in any hurry to unload shares this time around, with the holidays rapidly approaching and all. After all, there are bright blue skies directly overhead giving hope and respite from the early freeze blanketing the country.
In this weekly update, I give my view of the current market environment, offer a technical analysis of the S&P 500 chart, review our weekly fundamentals-based SectorCast rankings of the ten U.S. business sectors, and then offer up some actionable trading ideas, including a sector rotation strategy using ETFs and an enhanced version using top-ranked stocks from the top-ranked sectors.
Market overview:
Currency wars continue as central banks seek to stimulate their economies through devaluation in a race to the bottom, while corruption and ineptitude in places like Russia and Brazil destroy their currencies. It appears that the EU is finally starting to see some benefits, as its latest reported GDP growth showed up slightly to the positive side. Here in the U.S., GDP growth is expected to be at a 3.3% rate over the second half of 2014 and 4.4% for 2015.
As commodity prices continue to sink with a strengthening dollar and no inflation in sight, the former largest public company in the world Exxon Mobil (XOM) has seen its market cap tread water at around $403 billion), while Apple (AAPL) continues to pull further ahead ($670 billion) and Microsoft (MSFT) moves into the second spot ($409 billion). As discussed below, our fundamentals-based SectorCast rankings score Energy and Basic Materials at the bottom, primarily because of Wall Street’s continued downward revisions in forward earnings estimates. Nevertheless, both sectors have seen such price declines that their forward valuations are still quite attractive compared with the overall market.
So, how is the overall market valuation right now? On the one hand, the S&P 500 P/E using trailing inflation-adjusted earnings is about 25 right now. However, this is the same historically elevated level it has been since 1990, so there is no imminent danger about it. Moreover, forward P/E on the S&P 500 is about 16, and the spread between the S&P 500 earnings yield (6.3%) and the 10-year Treasury yield (2.3%) is 4% versus the historical norm of about 3%. Also, robust stock buybacks are likely to continue for a while at the prevailing ultra-low borrowing rates, which lowers the denominator in EPS and offsets new stock offerings and IPOs that typically serve to increase the denominator and dilute the overall profit pool. So, the market’s forward valuation is still reasonable.
As investors have embraced their new paradigm of elevated valuations, fear of missing out rather than fear of losing capital, and only brief bouts of market weakness that serve as fleeting buying opportunities, old hands at this game have been slow to adjust. This is why so many hedge funds lost a good bit of money in October, even though the market actually finished the month in the green. It seems that most of them dumped their favorite ideas, like longs in S&P and Nikkei futures, and shorts in the euro and yen, when they encountered that sudden and long-overdue spike in volatility, but then all those prior positions suddenly reversed and went back above their prior highs.
Yes, despite the current technical consolidation and lack of hedge fund participation in the V-bottom recovery rally, equity bulls remain in control with support from retail investors, who have been pouring their money into equity ETFs and mutual funds to the tune of $35 billion over the past three weeks, along with corporations, who continue to deploy their big cash stash for stock buybacks. But as I said in last week’s article, that doesn’t mean investor are going all-in with speculative picks. Prior high-fliers like Tesla Motors (TSLA), Yelp (YELP), Netflix (NFLX), Bazaarvoice (BV), and Cornerstone OnDemand (CSOD) have lagged since the V-bottom.
The CBOE Market Volatility Index (VIX), a.k.a. fear gauge, closed Friday at 13.31, which is right about where it closed the previous Friday. Despite spiking above 30 during October for the first time since 2011, it has remained below the important 15 threshold for a few weeks now, as investors are back to feeling good about U.S. equities. This week, the FOMC meeting minutes will be released, and November options expire.
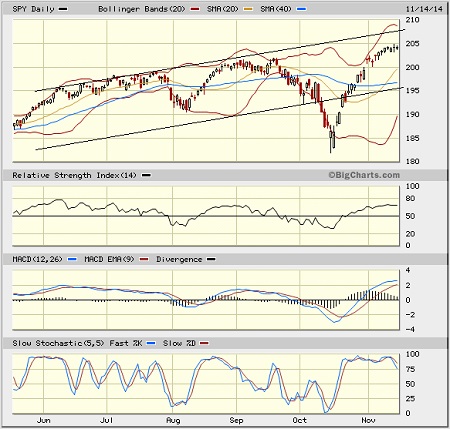
SPY chart review:
The SPDR S&P 500 Trust (SPY) closed Friday at 204.24 after setting a new 52-week high during the week (as did the Dow Jones Industrials and NASDAQ). In fact, the S&P 500 has closed above its 5-day simple moving average 21 days in a row, which hasn’t happened since 1996. However, the market has basically flat-lined for the past week as it tries to consolidate its big run off the October V-bottom. Often, stocks can work off those overbought conditions without giving up a lot of ground, but as it stands now, oscillators RSI, MACD, and Slow Stochastic all remain overbought and really need to cycle back down to set up a nice foundation for the anticipated Santa Claus rally. I still think the 200 price level may be tested for support during this technical consolidation phase before such a rally can launch. But with price sitting well below the upper line of the long-standing rising bullish channel, there is still a good chance of a renewed rally achieving new highs before year-end. Note, however, that the Russell 2000 small cap index has not hit new highs, and might find strong resistance at the 1200 level.
Latest sector rankings:
Relative sector rankings are based on our proprietary SectorCast model, which builds a composite profile of each equity ETF based on bottom-up aggregate scoring of the constituent stocks. The Outlook Scoreemploys a forward-looking, fundamentals-based multifactor algorithm considering forward valuation, historical and projected earnings growth, the dynamics of Wall Street analysts’ consensus earnings estimates and recent revisions (up or down), quality and sustainability of reported earnings (forensic accounting), and various return ratios. It helps us predict relative performance over the next 1-3 months.
In addition, SectorCast computes a Bull Score and Bear Score for each ETF based on recent price behavior of the constituent stocks on particularly strong and weak market days. High Bull score indicates that stocks within the ETF recently have tended toward relative outperformance when the market is strong, while a high Bear score indicates that stocks within the ETF have tended to hold up relatively well (i.e., safe havens) when the market is weak.
Outlook score is forward-looking while Bull and Bear are backward-looking. As a group, these three scores can be helpful for positioning a portfolio for a given set of anticipated market conditions. Of course, each ETF holds a unique portfolio of stocks and position weights, so the sectors represented will score differently depending upon which set of ETFs is used. We use the iShares that represent the ten major U.S. business sectors: Financial (IYF), Technology (IYW), Industrial (IYJ), Healthcare (IYH), Consumer Goods (IYK), Consumer Services (IYC), Energy (IYE), Basic Materials (IYM), Telecommunications (IYZ), and Utilities (IDU). Whereas the Select Sector SPDRs only contain stocks from the S&P 500, I prefer the iShares for their larger universe and broader diversity. Fidelity also offers a group of sector ETFs with an even larger number of constituents in each.
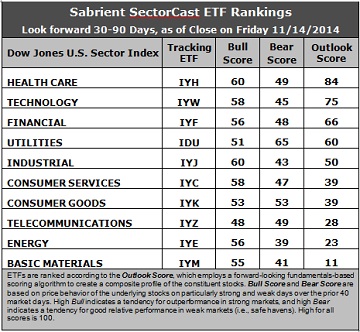
Here are some of my observations on this week’s scores:
1. Healthcare retains the top spot with an Outlook score of 84. It along with Utilities are the only sectors seeing net positive revisions to its earnings estimates from sell-side analysts. Healthcare also displays a strong forward long-term growth rate, solid insider sentiment (buying activity), and good return ratios. Technology is now in second place with a score of 72. Although Tech stocks continue to get hit with downward earnings revisions, the sector overall displays relatively strong factor scores across the board, including the strongest return ratios and a good forward long-term growth rate, although its forward P/E is beginning to suffer as prices continue to rise among stocks in the sector. Financial remains in third with a score of 66, and it still boasts the lowest (most attractive) forward P/E. Rounding out the top five are Utilities and Industrial. Utilities takes fourth place with a nice 20-point jump this week as its forward P/E has become more attractive with its recent price decline.
2. Energy and Basic Materials continue to be battered with negative earnings revisions from Wall Street. As a result, Basic Materials remains in the bottom of the Outlook rankings this week. The sector also displays low insider buying activity and poor return ratios. Energy now had fallen into the bottom two, even though its forward P/E is attractive.
3. Looking at the Bull scores, Healthcare and Industrial display the highest scores of 60, while Telecom scores the lowest at 48. The top-bottom spread is 12 points, reflecting high sector correlations during particularly strong market days, i.e., highly correlated risk-on behavior. It is generally desirable in a healthy market to see low correlations and a top-bottom spread of at least 20 points, which indicates that investors have clear preferences in the stocks they want to hold, rather than the all-boats-lifted-in-a-rising-tide (risk-on) mentality that dominated 2013.
4. Looking at the Bear scores, Utilities again displays the highest score with a robust 65 this week, as one would expect for this traditionally defensive sector. Utilities stocks have been the preferred safe havens on weak market days. Energy displays the lowest score of 39, followed closely by Materials. The top-bottom spread is 26 points, reflecting low sector correlations on particularly weak market days. Again, it is generally desirable in a healthy market to see low correlations and a top-bottom spread of at least 20 points. Also displaying a Bear score above 50 is Consumer Goods/Staples (a.k.a., Non-cyclicals), which along with Utilities are traditionally defensive sectors that would be expected to have the highest Bear scores in a healthy market.
5. Healthcare displays the best all-around combination of Outlook/Bull/Bear scores, while Basic Materials is the worst. Looking at just the Bull/Bear combination, Utilities is the leader, followed by Healthcare, indicating superior relative performance (on average) in extreme market conditions (whether bullish or bearish). Energy is still the worst, although Materials and Telecom are close behind, indicating general investor avoidance during extreme conditions.
6. Overall, this week’s fundamentals-based Outlook rankings still look mostly bullish to me, despite the continued drumbeat of downward earnings revisions. Five of the top six sectors are economically-sensitive (or in the case of Healthcare, all-weather), and they also display the highest Bull scores. Also encouraging is the strong showing of Industrial and Consumer Services/Discretionary (a.k.a, Cyclicals). Keep in mind, the Outlook Rank does not include timing or momentum factors, but rather is a reflection of the fundamental expectations of individual stocks aggregated by sector.
Stock and ETF Ideas:
Our Sector Rotation model, which appropriately weights Outlook, Bull, and Bear scores in accordance with the overall market’s prevailing trend (bullish, neutral, or defensive), continues to indicate a bullish bias this week, and it suggests holding Healthcare, Technology, and Industrial (in that order, for those portfolios that might be due for rebalance). (Note: In this model, we consider the bias to be bullish from a rules-based trend-following standpoint because SPY is above both its 50-day and 200-day simple moving averages.)
Other highly-ranked ETFs from the Healthcare, Technology, and Industrial sectors include iShares Global Healthcare ETF (IXJ), PowerShares Dynamic Semiconductors Portfolios (PSI), and SPDR S&P Transportation ETF Trust (XTN).
For an enhanced sector portfolio that enlists some top-ranked stocks (instead of ETFs) from within the top-ranked sectors, some long ideas from Healthcare, Technology, and Industrial sectors include Horizon Pharma plc (HZNP), Valeant Pharmaceuticals International (VRX), CDW Corp (CDW), NXP Semiconductors NV (NXPI), Hawaii Holdings (HA), and Danaos Corp (DAC). All are highly ranked in the Sabrient Ratings Algorithm and also score within the top two quintiles (lowest accounting-related risk) of our Earnings Quality Rank (a.k.a., EQR), a pure accounting-based risk assessment signal based on the forensic accounting expertise of our subsidiary Gradient Analytics. We have found EQR quite valuable for helping to avoid performance-offsetting meltdowns in our model portfolios.
However, if you prefer to maintain a neutral bias, the Sector Rotation model suggests holding Healthcare, Technology, and Financial (in that order). And if you prefer a defensive stance on the market, the model suggests holding Utilities, Healthcare, and Financial (in that order).
Disclosure: The author has no positions in stocks or ETFs mentioned. The materials available from us are published solely for informational purposes. They are not to be construed as advice or ...
more

