
Interpreting The Yield Curve: Some Pictures
Recently Jim highlighted the odd behavior of the various Treasury term premia. Here are some additional thoughts. From “Debt market goes off script” in the WSJ:
Yields on short-term U.S. Treasury debt maturing in two to five years hit the highest level since 2011, reflecting an investor scramble to place bets on an expected Federal Reserve rate increase as soon as next spring. …
At the same time, yields on government debt maturing in 10 or more years have risen only modestly this week and remain well below their levels at the start of 2014, a year that many analysts forecast would include rising long-term interest rates and falling bond prices. …
The softness of longer-term yields highlights concerns shared by many analysts and policy makers about the uneven growth of the U.S. economy and falling expectations for inflation. Investors broadly expect the Fed to raise the fed funds rate next year for the first time since 2006. But many analysts say that even a small uptick in rates could slow the economy and send already-low inflation further below the Fed’s target.
A competing hypothesis was laid out in “US bonds are tracking ECB policy” in the Financial Times:
The link between US monetary policy and US bond yields has fallen apart this year, showing how fears of deflation in Europe are driving global financial markets.
According to analysis by the Financial Times, the correlation between five- and ten-year Treasury yields has fallen to its lowest level on record, with US bonds appearing to track European monetary policy instead.
Nominal and Real Spreads Are Still Positive, Despite Having Narrowed
Should we worry about imminent recession? There’s been some discussion of the age of the recovery and hence the anxiety. [0] [1] While spreads — both nominal and real — have indeed narrowed, they are still generally positive. As Chinn and Kucko note (blogpost), while spreads do not have extremely high explanatory power for recessions and growth, they do contain some information.
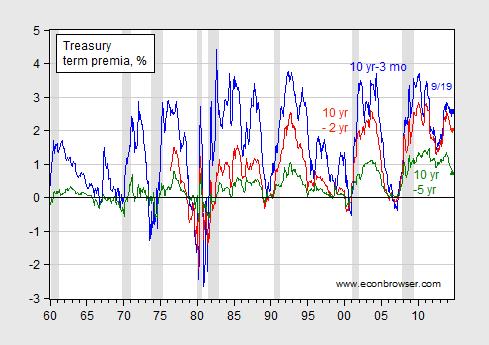
Figure 1: Ten year-three month spreads (blue), ten year-two year spreads (red), and ten year-five year spreads (green). Observations for September are for 9/19. NBER defined recession dates shaded gray. Source: FRED, and author’s calculations.

Figure 2: Ten year TIPS-two year Treasury minus 2 year expected inflation spreads (red), and ten year-five year TIPS spreads (green). Observations for September are for 9/19. NBER defined recession dates shaded gray. Dashed line at 2008M09. Source: FRED, Cleveland Fed and author’s calculations.
Has the Comovement between Ten and Five Year Yields Decreased?
The FT article documents the drastic drop in the 180 day daily correlation between 10 year and 5 year yields. On the other hand, the relatively large 10 year-5 year term premia shown in Figure 1 suggests the decline in yield comovement needs to be placed in context. Figure 4 shows that the one-year-window correlation does indeed drop drastically.

Figure 3: Correlation coefficient (blue), and regression coefficient, ten year on five year (red), one year window, monthly data. NBER defined recession dates shaded gray. Each observation pertains to the sample period encompassing the twelve month period ending in the observation. Source: FRED, NBER, and author’s calculations.
Jim made the same observation regarding correlations in his post. On the other hand, the regression coefficient (∂i10yr/∂i5yr) indicates that this period of low comovement follows a period of extremely high comovement. This casts in a slightly different light the assertion that the behavior of the five year has been abnormal in the past year. In fact, the behavior has been abnormal over the past four years. In that sense, looking back to Figure 1, the five year ten year gap has “normalized”.
Five Year Five Year Forwards
As Jim noted, one can use the information on ten year and five year Treasury yields to infer the five year yield expected five years from now. The calculation is simple if the pure expectations hypothesis of the term structure (EHTS) holds.
(1a) it10y = (it + Etit+1 + … + Etit+9)/10
(1b) it5y = (it + Etit+1 + … + Etit+4)/5
(1c) Etit5y = (it+5 + Etit+6 + … + Etit+5)/5
Which implies:
(2) Etit+55y = it10y×2 – (it5y)
Since the pure EHTS does not hold, one needs to adjust by the term premia; I use the same adjustment that Jim uses. This yields Figure 4.
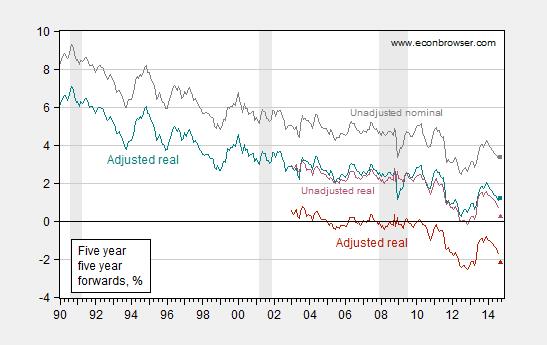
Figure 4: Nominal five year five year forward, calculated as 2 × i10yr- i5yr (light gray), Nominal five year five year forward adjusted for premia (dark blue), and TIPS five year five year forward (red). September observations are for 9/19. NBER defined recession dates shaded gray. Source: FRED, NBER, and author’s calculations.
This interpretation (which presumes the EHTS with constant term-specific liquidity/risk premia is correct) suggests low real borrowing rates for the US government for the period 2019-2024.
The International Thesis
The FT article suggests that ECB monetary policy — or anticipation thereof — is driving the decline in the long dated US Treasurys. The movements in the ten year yields are shown in Figure 5.
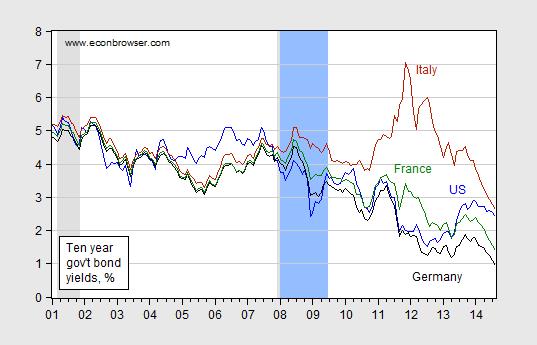
Figure 5: Nominal ten year constant maturity government bond yield for US (blue), ten year on the run government bond yields for Italy (red), France (green) and Germany (black). NBER dated recessions shaded gray, CEPR dated recessions shaded light blue. Source: FRED, ECB, NBER, and CEPR.
The downturn in US ten year Treasury yields could reasonably be ascribed to the downward movement in Euro area government bond yields; to me, there are two problems with this view. The first is that in the econometric work I have conducted in the past, US rates are typically weakly exogenous for foreign (European) rates (or have unidirectional explanatory power).[2] The second is that the evolution of the US-Germany ten year gap is virtually indistinguishable from the US-Germany five year gap.

Figure 6: Nominal ten year US-Germany government bond yield differential (blue), and five year differential (red). NBER dated recessions shaded gray, CEPR dated recessions shaded light blue. Source: FRED, ECB, NBER, and CEPR.
Given these observations, I am more inclined toward the interpretation that the markets are pricing in a period of lower rates in the period five years hence — both in the US and the euro area — than in ECB policies driving US rates.
Disclosure: None.


