
Inflation Monitor – June 2017
"The equity market continue to float on a cloud of who knows what". | "This is not like any market anyone alive has seen before." | "There is no euphoria, which is usually not a sign of a market peak." | "There is enough pessimism for the market to continue climbing higher." | "The engine seems to be running, but no one has bothered to look under the hood." -- These are just some of the comments I have heard from portfolio managers in the past month.
This month I want to discuss the topic of value. Value is a term that means different things to different people. Frequently. people use the term to describe investments that are "cheap". Of course, "cheap" also means different things to different people.
Take for example a bar of chocolate. 100 years ago you could buy chocolate for $0.03 per oz. Today you are paying close to $0.50 per oz. for the same chocolate. Has anything changed? Did you get a better deal 100 years ago? Of course inflation plays a part in this simple equation, but this simple equation makes the point that prices relate to other things which you use to justify whether something is cheap or expensive. (I used chocolate because it has a historical tendency to correlate to inflation.)
Now, lets look at today's equity and bond prices.
Bonds
Today, we are at an interesting point in time. We have had a historic bond bull market for the past 36 years. Rates peaked in 1981 and have dropped ever since (bottoming out last year). So if you think bonds are safe, think again. Your recency bias makes you think bonds are safe because you have experienced nothing but rising prices (plus interest) from bonds for 36 years.
The same recency bias also makes you believe that positive inflation is normal and constant, but I digress...
Bonds are actually extremely risky right now, if you don't know what you are doing. Not only are interest rates still historically low, but they are rising. This is great if you are looking for more interest, but bad if you are holding bonds which are declining in price.
So are bonds cheap or expensive?
Well, if you compare US bond yields to global yields, the US is cheap (i.e. yields in the US are higher than other countries). However, if you compare the US yields to their own historical yields, bonds are still very expensive. I am simplifying this quite a bit to provide you with some context.
Generally speaking, bonds are expensive. If you are retired or close to retirement, this is a problem. You need income and you cannot find many low-risk income sources with a high enough yield enough to live off of. Think about it this way. It was not long ago that you could get 5% on fixed income investments that were not risky. This means if you have $1,000,000, you could live off of $50,000 a year in income. However, today that same $1,000,000 would yield $15,000 a year in income. If you add in inflation, you have even less in spending power.
So are bonds expensive? YES.
Stocks
Now, let's look at stock prices...
Stocks are also subject to the same judgement of value.
Are they cheap or expensive?
It depends on who you ask. Here is a chart that will give you an idea of what I mean.
(Click on image to enlarge)
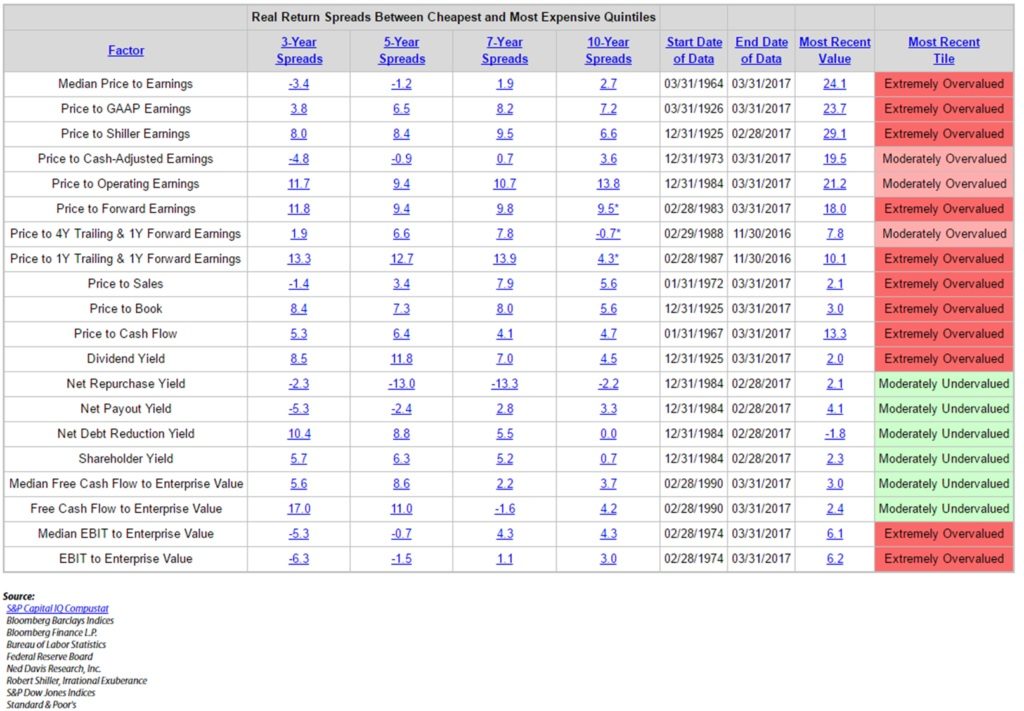
Here are 20 different ways to look at the valuation of the equity markets. I'm sure I could come up with more than 20, but it should give you an idea of how complex the idea of valuation is.
If you have watched CNBC in the past few years you are probably equally confused about whether stocks are cheap or expensive. Anyone can pick out a metric and say that this is the reason stocks are expensive or cheap. There is no singular way to measure value other than experience and judgement.
Let me give you an example. If you look at stocks today, most people would say they are expensive. However, compared to 1999, they are cheap. In 1999, they were extremely overpriced, so it is a bad comparison, but people in the media today are comparing stocks to 1999 valuations.
What you should note is the situations are very different. In 1999, interest rates were around 6%. Today they are around 2.25%. If you are not well versed in how interest rates affect other investments, there is a concept of what is called the "risk-free rate of return". This is a theoretical rate of return that has no risk (it is theoretical because riskless investments doesn't exist). Markets traditionally use the 3-month Treasury Bill yield as the risk-free rate of return because this is the closest thing to a risk-free investment that exists.
The risk-free rate of return is important because when you look to invest your money, you should compare any investment to this risk-free rate of return. You should ask yourself, is the increased risk worth the return you would get from from the investment.
I don't want to get too far down the rabbit hole of investing theory, so I'll get to the point. The risk-free rate of return is important because when this rate is 0%, it makes a dividend stock paying 3-4% dividend yield very attractive. This is a major reason stocks have risen so much in recent years. Why would someone want 0.25% yield on a bond when you could get 3-12% on stocks?
Granted this is a flawed argument, but that is how investors perceive the equity markets.
So are equity price expensive? Yes and no.
Yes, they are expensive compared to most metrics. No, because if the US congress passes some much needed tax law changes, we could experience some tremendous growth. It further complicates the discussion in that there are very few places to invest that would provide a reasonable rate of return outside of the US equity markets. This is not a rational way to invest, but that is how many investors are allocating their money.
I have been looking around for the past few years for pockets of value. There are very few left. The equity markets are in large part overvalued in the US. Europe is seeing a bit of a revival due to their own version of QE. Japan is as well. Real estate is expensive in the US (who wants to buy real estate with a cap rate of 2-4? Apparently more people than is prudent). Alternative investments that are not traded on public exchanges are also expensive. There are very few places for value investments to hide in a global economy, which has too much money chasing too few investments.
We have recently found some really interesting investments. We are currently doing due diligence on them now. This takes time to be thorough, but considering the alternatives, it is worth the effort. These are particularly interesting given the lack of "value" investments that are also cheap.
Bitcoin
I would be remiss if I didn't mention bitcoin. Apparently bitcoin is the new gold. Everyone is talking about it. It is on all the media stations and on the lips of cocktail party attendees. It is amazing how it went from relative obscurity and disdain to an acceptable place to store your money.
I'll briefly summary what has happened if you are living in the woods and don't have access to news sources. Bitcoin is a virtual currency that has been around for years. It is supposed to be a currency that is not subject to government influence or devaluation. It is a commendable experiment that seems to have worked so far.
The underlying technological architecture (block chain) itself has spun off many other notable uses that could improve the financial system across the globe. But this is not the subject of this section.
Bitcoin started around $0.08 in 2010, now it is up to around $2,460. This is a huge rise in 7 years. However, even with this historic rise rivaling the tulip mania in the 1600s, Bitcoin managed to rise more than 100% last year, and more than double in the past month. Think about the value of this asset in a few years from now at this rate of increase. Of course, price rises like this do not always go up, but certainly there is a strong numerical reason for prices to continue to rise over time.
Simply put, there are only a certain number of bitcoin and a rapidly rising volume of demand for a limited supply of coins. Japan just allowed their citizens to use Bitcoin for commerce and payment of taxes. Australia will start to do the same in July 2017. Sure there will be bumps in the road to mass adoption, but the trend is strong.
The analysis of this as an investment is simple. You have to assume that any money you put into bitcoin will go to zero. If you are comfortable with this, then the upside is multiples higher. This is the essence of an asymmetric risk trade. A defined downside and upside with a higher multiple more than the risk involved.
This is a hedge fund managers dream. I suspect that many of them are getting involved right now.
I cannot find any way to hedge or short this asset, which makes the asset even more interesting. I am curious about how high bitcoin will go when the institutional money starts to flow into it. It is a bit risky to get in at these prices, but I suppose you could have said that when it was trading at $7 after rising from $0.08. Time will tell, but it makes for a fascinating case study.
Pension Obligations
I don't see much written about this topic outside the institutional financial services community. If you are looking for a black swan that is right in front of your face, this is it.
I frequently read about how social security is insolvent or a ponzi scheme (which may technically be true, except that it is easily fixable with a printing press). I also read about how the US dollar is going to be worthless, yet it has climbed around 20% compared the the global currency basket in the past 2 years.
These are all nice "scare you" headlines, but not immediately relevant. The Earth will also burn up when our sun explodes, but none of us will be alive to see that happen. So let's talk about what is immediately relevant.
Your State Pension Obligations. Each state in the US, has pension obligations to certain groups (state worker, teachers, government entities). These pension obligations are essentially a contract with the workers to pay them a pension at their retirement (assuming they meet certain requirements) as a job benefit. Every state has a similar setup.
Pensions are essentially a pool of money that is supposed to provide a retirement income to the pensioners for the remainder of their lives. The sponsors of the pension have an obligation to put enough money in the pension to support the retirement income benefit. This money is typically less than the amount which is estimated to be paid out to the pensioner. The shortfall is made up by growing the pool of money at certain rate of return.
For example, Lets say you run a pension valued at $100,000 and you needed to pay $110,000 in 2 years. You would need to grow the pool of money at approximately 5% a year to meet your obligations. This mathematical construct works as long as the assumptions hold true. Lets say that the portfolio only grows at 2% a year. Then you would only have $104,000 when you need to pay out $110,000. You are $6,000 short on your payments. How will you make up the difference?
If you are running the state pension plan, you would have to make it up with an infusion from the state treasury (i.e. higher taxes).
This example is a simplified version of how pensions work. It is even possible to create your own pension, if you so desired.
Pensions were created to function in perpetuity by making certain assumptions about returns and contributions into the pension. Of course this may not happen if they are not run appropriately. As you will see below, they are not being run appropriately.
There are two important variables when it comes to pensions: The amount of money being contributed to the pension plan and the growth rate of those funds.
Many state pensions use these variables of growth rate and contribution to the pool to "manage" the amount of money they contribute each year. While I am picking on my home state of Massachusetts, many other states are just as bad if not worse (e.g. Illinois).
Lets look here at this table (you can find the full table of Mass state pensions and their funding ratios here). This chart illustrates the funding ratios for each entity and how it has changed in the past 15 years. Mass Teachers Retirement System was relatively well funded with a 80+% funding ratio in 2000, but now it is down to 54.3%. Once it drops below 50% it is almost impossible to sustain the pension. It enters what can be called a death spiral.
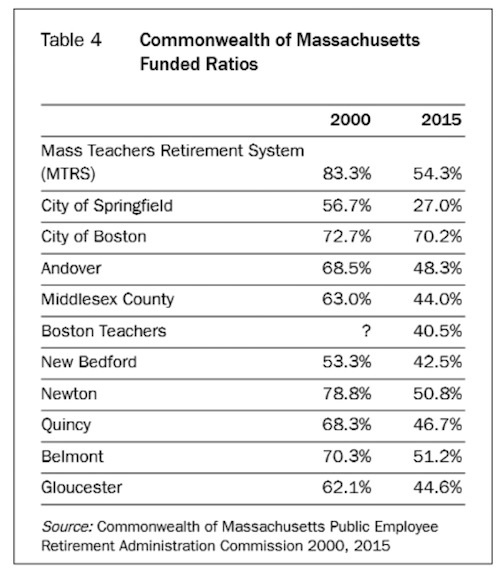
The city of Springfield is now at a 27% funded ratio. This is the most poorly funded state pension in Mass. Compare this with Massport (the destination of many Massachusetts politicians when they retire from politics) which has a 91% funded ratio. Are our teachers less important than our politicians?
If you look at the link I provided above you will notice that it provides an assumed investment return assumption. In December of 2016, CalPERS dropped their return assumptions to 7% from 7.5%. This is a historic decision that will have wide ranging impact on pension systems around the country. Many pensions use similar standards, so the largest state run pension will inevitably impact other assumed investment returns.
If you look at North Attleboro and Watertown, they have an assumed 8% return assumption for their pension. Are they better are managing money than the largest pension fund in the US? Maybe, but what if they are all over-shooting their assumptions. Leominster assumed 5.5% returns on their pension funds. I think this may be closer to the mark.
If other pension funds lowered their assumed returns to 5% you would see a much more dire scenario for their pension recipients. The funded ratio of 75% might look more like 50%. You might even see a run for the door like the the Dallas Police and Fire pensions.
Here is the problem, not only is a potential run on the pension a very real problem, but also the state will have to kick in the extra funds to support the under-funded pension. This means your tax rate will go up to support this mismanagement. Or the state will tell the pensioners to jump in a lake and assume a lower retirement income. I personally don't like either scenario, but the outcome is inevitable once you hit the 50% marker. So Springfield funded ratio of 27% at 7.65% will look even worse with a 5% assumed return.
Now, let's look at some of other other states which are worse offenders. In 2015, Illinois is the worst with a 39% funded ratio, then Kentucky (44%), Connecticut (48%) (CT is especially poorly run with the highest ranked per capital income in the US with the 3rd worst funded ratio), Alaska (52%, New Hampshire (57%), Rhode Island (58%), Louisiana (58%), Michigan (60%), Kansas (60%), and Hawaii (60%).
If you live in one of these states, you might want to consider retiring elsewhere or you might be picking up the tab of your state's poorly funded pension. Anecdotally, I have received a number of calls from state employees who worked in Illinois and are looking to take their money and move to a different state. It is possible the run is just starting in IL.
The thing about assumptions is that they tend to be wrong over time. When you make an assumption like a solvent pension or positive inflation, and you are wrong, it can cause a black swan event with unexpected outcomes. While Puerto Rico is not a state, they are having issues with being poorly run financially. You might want to watch how they are treated by the US to set some expectations for the state pensions when they come under fire.
Market Risks
I want to make one more point before I provide you with an abundance of charts to look at. The publicly traded equity and bond markets typically move on the expectation of future events. Right now, the equity markets in the US are higher, based on the expectation of a stronger economy and lower corporate taxes. If these plans get derailed, you might see the equity markets swoon. Some of the world's smarter investors have claimed that the US economy should be fine for the next ~2 years, but after that it could get really ugly. We are overdue for a recession in the US (if you ignore the recent 5 quarters of negative earnings growth in the US). The longer we go without a recession, the more likely it will be severe. You can use the reversion to the mean theory to get some idea of the severity. It is hard to say what will be the catalyst for the next recession, but it is usually something that no one expects.
The US auto market is starting to soften and this could be something that could derail the bond market. If you read my 2015 Recap post from 18 months ago, I discussed how contagion works and how the decline in oil prices almost caused the economy to implode. It is an important concept to understand, since this is in large part what drive markets today. Every asset is correlated and connected via institutional investors, so when the selling starts, it causes other assets to sell off regardless of the soundness of the asset.
I see no signs of this happening at the moment, but you should be aware of it if you are investing in equities.
There is also the concern about credit markets. Some consumer loan and auto loan originators are starting to have difficulties as are some of the rental car companies. I see this as being a big risk in the markets right now, however these markets may not be big enough to cause contagion (i.e. these crisis may be self-contained). The collapse of the real estate market in 2005-2010 affected everything because people have to live somewhere and it is usually their biggest asset. But cars are not essential and may not cause the same type of crisis that we saw in real estate.
Some other interesting points of note are the fact that there is an enormous ETF bubble taking place.
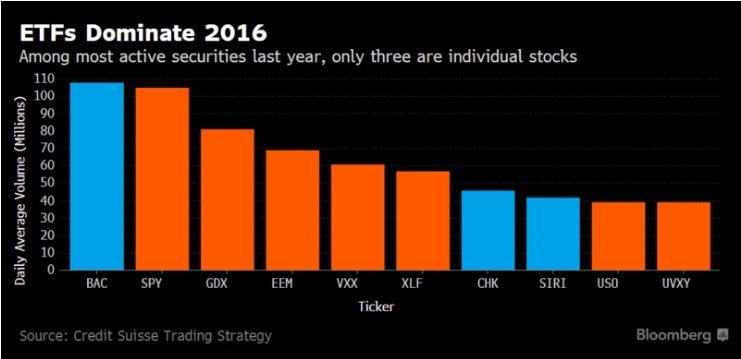
If you notice in this chart, the most actively traded securities are primarily ETFs. Only 3 of the top 10 most traded securities are stocks, the rest are ETFs.
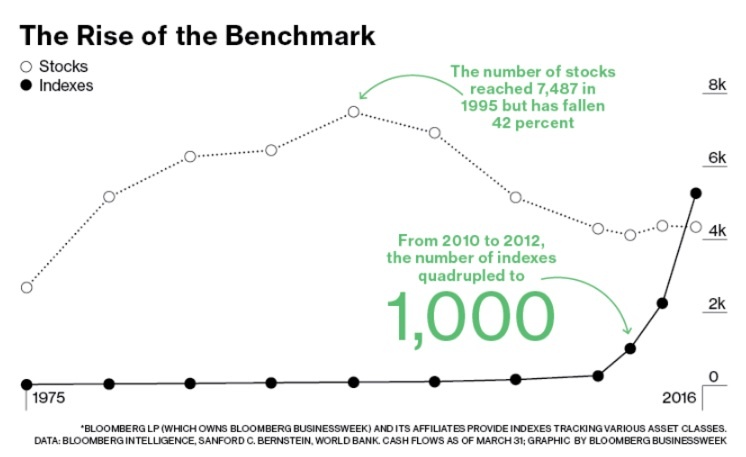
According to Bloomberg, there are now more indexes (passive ETFs) than stocks. Think about this for a moment. Indexes are made up of stocks, bonds, and other similar securities. Now there are more indexes than stocks that are owned in these indexes. Think about how that math works.
Not only are ETFs controlling the money flowing into the market, but the central banks are getting into the fun as well. The Swiss National Bank currently (as of 3/31/17) has over 18,894,016 shares of Apple stock worth $2,714,314,000. They also own shares in many other US stocks in the S&P 500. Now that central banks are visibly investing in the US stock market, I would imagine things could get a bit interesting.
While the US economy seems to be running ok for the moment, there are some risks to keep an eye on.
This article is intended solely for informational purposes only, and in no manner intended to solicit any product or service. The opinions in this article are exclusively of the author(s) and may ...
more


Thanks