
Inflation Indicators Getting A Little Jiggy
https://nftrh.com/about-tos/10yr Breakeven has been rising for a few months now and is in a potential bottoming pattern.
(Click on image to enlarge)

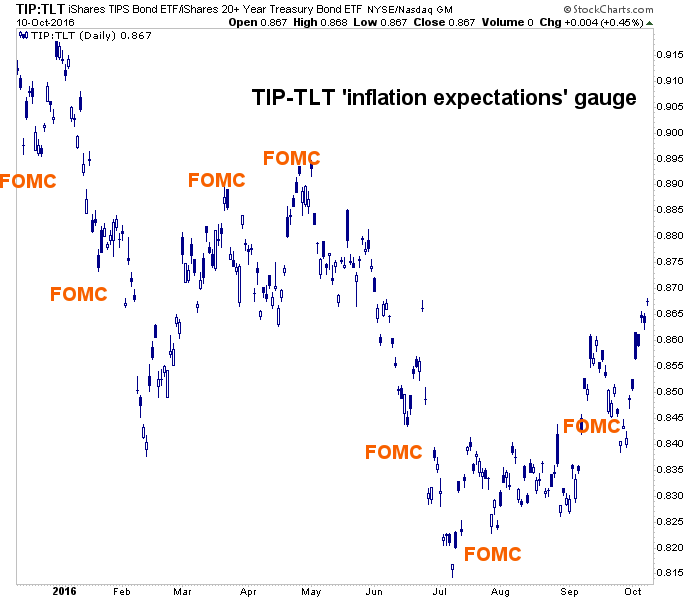
The TIP-TLT ratio chart has broken a trend line.
(Click on image to enlarge)

And FOMC chose to punt once again. Come December they may not have a choice.
(Click on image to enlarge)
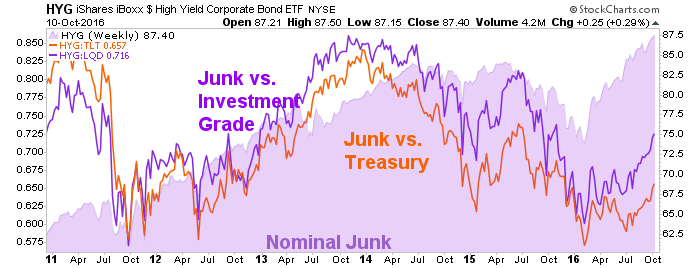
Not that they are blowing any bubbles or anything.No, people are just rationally buying junk bonds to new cycle highs despite rising Treasury yields for the sport of it.What a joke.
(Click on image to enlarge)
Disclosure: Subscribe to more
How did you like this article? Let us know so we can better customize your reading experience.


Thanks