
Indices Under Pressure – Again – Bulls Need To Defend Recent Lows
Major US equity indices are once again under pressure, likely eyeing recent lows. In the event they are not breached, options can offer an opportunity for nimble traders.
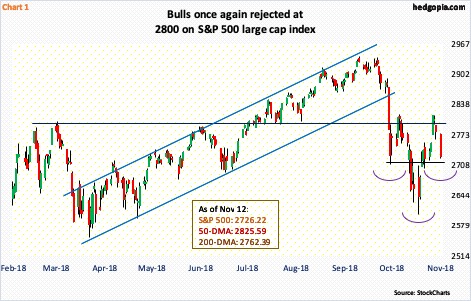
Bears were looking at decent odds to get aggressive last week. The rally that began late October came to a screeching halt a week ago (Chart 1). Right where it could ideally have for them.
On the S&P 500 large cap index (2726.22), between the all-time intraday high of 2940.91 on September 21 and the low of 2603.54 on October 29, the index fell 11.5 percent. A 0.618 Fibonacci retracement of that decline comes to 2812.03. Fibonacci followers take this golden ratio very seriously, hence these numbers are always worth a close watch. For the past eight months, 2800 has also proven to be an important horizontal level where bulls and bears fought several tugs of war. This area also approximates the underside of a broken rising trend line from February 2016. All in all, resistance at 2800 was tough, and it held.
Last Wednesday, post-Tuesday’s mid-term elections, the S&P 500 shot up 2.1 percent, but then the momentum stopped dead in its tracks. The intraday high of 2815.15 in that session essentially tested 2816.94 on October 17 – unsuccessfully.
Arguably, shorts anticipated this, expecting either a test of recent lows or worse. In the latter scenario, overbought monthly indicators can continue to unwind.
In the October 16-31 period, short interest on SPY (SPDR S&P 500 ETF) rose 3.3 percent period-over-period to 186.3 million shares. In all of October, it jumped 23 percent. As early as mid-August, short interest was 143.3 million.
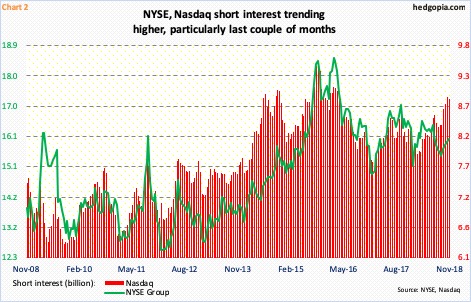
NYSE and Nasdaq short interest shows a similar trend. On the Nasdaq in particular, shorts have been persistently adding all this year (Chart 2). The mid-October high of 8.9 billion shares was the highest since mid-March 2016.
If longs can regroup in time, the rather elevated level of short interest in due course can end up helping them as shorts begin to lock in profit. As a matter of fact, on the S&P 500 they are staring at one such opportunity. The volatility over the past month has created a potentially bullish reverse-head-and-shoulders pattern. For that, two things need to happen – (1) hold 2700 and then take out 2800. Should things evolve this way, technicians would be eventually eyeing 3000.
For now, bears hold the ball.
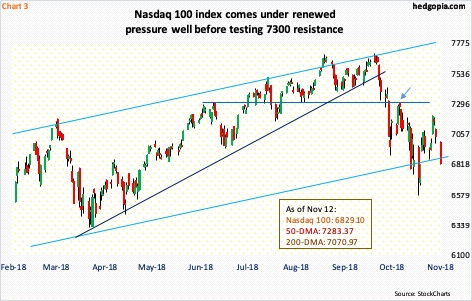
This includes the Nasdaq 100 index (6829.10), where shorts are getting aggressive. On October 17, rally attempts were denied at horizontal resistance at 7300 (arrow in Chart 3). Last Wednesday, sellers showed up well before that high could be tested. As a result, the index has now charted out lower highs, lower lows. What the bulls do not want to see happen is continued weakness that ends up undercutting the recent lows. The daily chart remains overbought and has room to continue lower.
Alternatively, bulls should find it encouraging if the index continues to come under pressure but the lows hold.
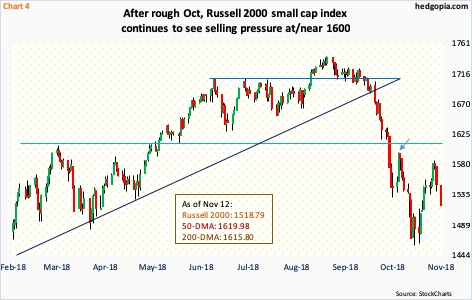
This also holds true with the Russell 2000 small cap index (1518.79), where since January this year bulls and bears have been repeatedly involved in a duel just north of 1600. The index first broke out of it in May, followed by a breakdown during October’s selling. The support-turned-resistance was tested mid-October when on the 16th the index retreated just shy of 1600 (arrow in Chart 4). Last Thursday, it tried to go after that resistance again, but fell way short, for a lower high. Late October, bulls stepped up to defend 16-month support at 1450s, which has now gained in significance. The daily lower Bollinger band lies around there as well.
Near-term, odds favor a test of these lows on all these three indices. Bulls have their work cut out if they are unable to save this support. But assuming a breach does not occur, an opportunity may be at hand for nimble traders.
Take SPY ($272.57). If hypothetically in the next four sessions the ETF does not drop more than 1.4 percent and does not rally more than 1.7 percent, a weekly iron butterfly offers decent risk-reward odds.
November 16th SPY iron butterfly:
- Long 282 call at $0.09
- Short 273 call at $2.33
- Short 273 put at $2.62
- Long 264 put at $0.57
The net credit collected is $4.29. Maximum potential loss is $4.71. Breakeven points are $277.29 and $268.71.
Disclaimer: This article is not intended to be, nor shall it be construed as, investment advice. Neither the information nor any opinion expressed here constitutes an offer to buy or sell any ...
more

