
Indicator Review: Seasonal Winds Now Favor…
Good Monday morning and welcome back. Let’s once again start the week off right with a review of our major stock market indicators. To review, the goal is to set aside our subjective views of what we think might be happening in the markets and focus on a disciplined, unemotional review of what “is” happening in the market.
The State of the Trend
We start with a look at the “state of the trend” from our objective indicator panel. These indicators are designed to give us a feel for the overall health of the current short- and intermediate-term trend models.

Executive Summary:
- With the S&P 500 now below its 5- and 10-day moving averages and the 5-day now below the 10-day, the short-term trend has to be rated as down
- Intermediate-term trend still in good shape
- The Channel Breakout systems are in good shape
- Short-term Channel Breakout would issue sell below 2187
- Cycle Composite suggests strong week, a pause, then up into end of year.
- All 3 Trading Mode models still say this is a mean reverting environment (bulls would prefer a trending higher mode reading)
- But after recent run, a pause is to be expected
The State of Internal Momentum
Now we turn to the momentum indicators…
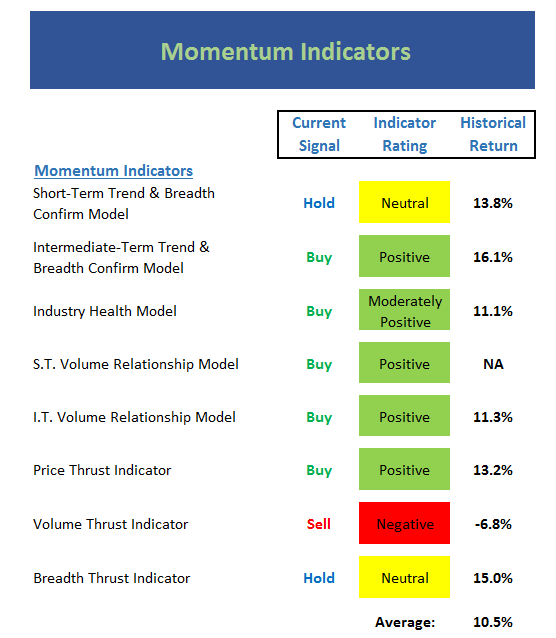
Executive Summary:
- Short-term Trend & Breadth model slipped to neutral
- Intermediate-term Trend & Breadth model still positive
- Industry Health model remains moderately positive – would prefer to see an outright positive reading and thus, this remains a nagging background concern
- Volume Thrust model went negative. Note that this model is based on the NASDAQ Composite, which has been experiencing a rotation trade from the sol-called “FANG’s” (big-name, large-cap tech)
- Breadth Thrust model slipped to neutral this week – ditto on the reason
The State of the “Trade”
Next up is the “early warning” board, which is designed to indicate when traders may start to “go the other way” — for a trade.
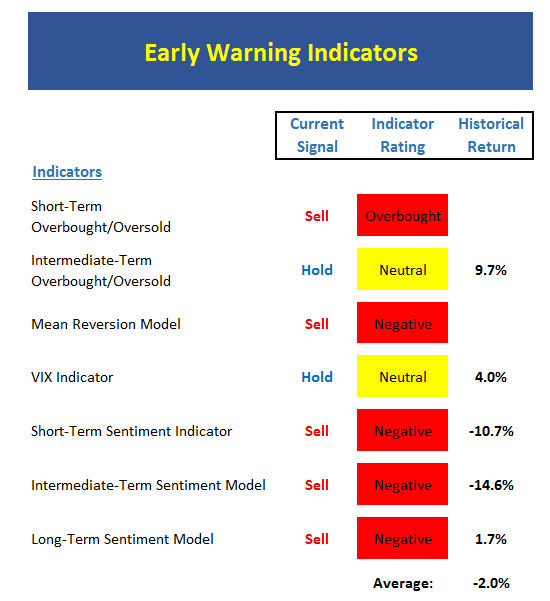
Executive Summary:
- A short-term overbought sell signal was issued early last week
- Stocks are now neutral from an intermediate-term overbought/sold perspective
- The Mean Reversion model gave a timely sell recently. The model is still on sell signal, but the model reading is returning to neutral.
- A short-term VIX sell signal was given last week
- VIX model – which is intermediate-term based – never reached extreme overbought reading
- All three Sentiment models still negative
The State of the Macro Picture
Now let’s move on to the market’s “external factors” – the indicators designed to tell us the state of the big-picture market drivers including monetary conditions, the economy, inflation, and valuations.
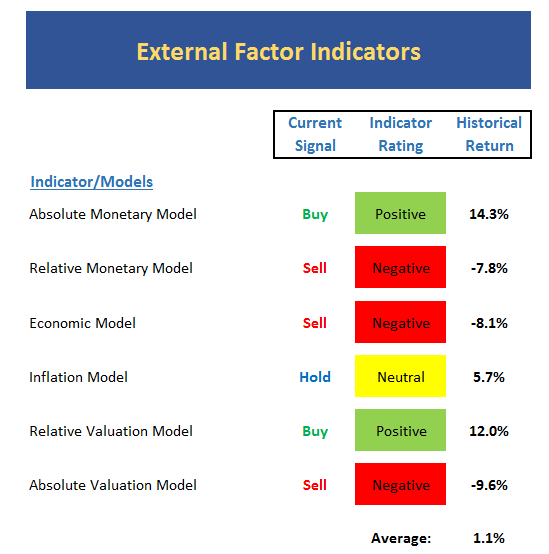
Executive Summary:
- The Relative Monetary model dipped into the negative zone last week
- Since 1981, stocks have lost ground at a rate of -7.8% when negative reading on Relative Monetary model
- Economic model (designed to “call” the stock market) remains negative, but lost more ground last week
- The Economic model designed to “call” the economy is in “strong growth” mode
- The Valuation models have held steady
- The Median P/E model (not shown) has actually improved in recent months
The State of the Big-Picture Market Models
Finally, let’s review our favorite big-picture market models, which are designed to tell us which team is in control of the prevailing major trend.
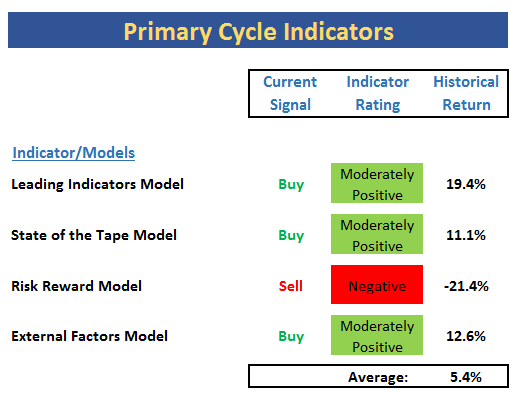
Executive Summary:
- Leading Indicators model remains moderately positive after the brief, one-week dip into the neutral zone
- The Risk/Reward model remains negative – primarily due to the monetary components
- Historically a rapid rise in rates has been negative for stocks
- However, this time the spike in rates is coming from all-time low levels and is due to improving economic expectations. Thus, the reason for the rate increase can be viewed as a positive.
- The average return for the board remains below trend at 5.4%
The Takeaway…
Traders hit the pause button on the rally in stocks last week. The market had become overbought. Sentiment had reached extreme levels. And with traders rotating out of big-cap technology names, a pullback in the venerable S&P 500 would appear to be about par for the course at this point in time. However, seasonal winds are now at the back of the bulls and investors are looking for the economy to perk up with the GOP promising reforms and stimulus. As such, some additional “discounting” of this narrative as well as some asset allocation adjusting is certainly possible as we head into 2017.


