
Increasing The National Debt By $6 Trillion In One Committee Meeting
Could a committee of unelected officials increase your household's share of the national debt by $60,000 in a single meeting? In normal times - they could not. However, these are not normal times, and any appearance of normality is deceptive.
The committee in question is the Federal Open Market Committee (FOMC). They met in March of 2018, and as expected, they raised the targeted range for Federal Funds rates by 0.25%.
As communicated with the release of the new "dot plot", the new median expectation of the committee is that they will raise rates three times in 2019, instead of the former two times. If the Federal Reserve does carry through and this happens, interest rates will increase by a total of 3.25% from their post-crisis lows by 2020, instead of the 3.0% that was previously expected.
If that mere 0.25% increase impacts all interest rates (short, medium and long-term), and if it persists over time, then two extraordinary things will happen that may each seem improbable for those who don't think in terms of financial mathematics.
The first is that for long-term savers and investors, that one 0.25% additional increase will be producing more annual compound interest in 30 years, more interest earnings on interest earnings, than the sum total of compound interest that could be earned in 30 years when investing at the post-crisis low-interest rates. Just that little "tweak" of adding another 3.25% instead of 3.0%, if given enough time, produces annual increases in wealth that would likely seem completely non-intuitive to the average person.
However, for a nation that is over $20 trillion in debt, and is borrowing all the money each year that is needed to make interest payments on that debt, the same mathematics of compound interest mean that a seemingly trivial 0.25% increase is enough to increase the national debt by an additional $6 trillion in 30 years.
If we look in round number terms at roughly 100 million households with incomes above the poverty line in the United States today, that translates into a $60,000 increase per household in their share of the national debt in 30 years. With the sole cause of that $60,000 increase for each of our household shares being paying another 0.25% in interest on the current and future national debt.
As analyzed herein the federal government has a nonlinear risk when it comes to interest rate increases, and seemingly trivial changes can create financial problems that far exceed what most people would intuitively expect.
These numbers seem fantastic - because the situation is fantastic. The reason for this analysis is not to depress or to predict gloom and doom, but to make crystal clear that the future cannot be like the past, and what was normal in prior times just won't work for much longer.
The implications are likely to change performance in all the major investment categories including stocks, bond, real estate and precious metals. Indeed, because the future can't be like the past, those engaged in long-term financial or retirement planning are likely to be surprised again and again if their plans are based on historical "normality".
This analysis is part of a series of related analyses, an overview of the rest of the series is linked here.
A $6 Trillion Increase
The previous analysis "The Potential $54 Trillion Cost Of The Fed's Planned Interest Rate Increases" (linked here) took a detailed look at the long-term implications of the Fed's intentions to likely raise interest rates by 3.0%.
As explored in that analysis, paying an average 2.25% interest rate on the federal debt in combination with the continuation of current deficits and the extraordinary expenses of the Social Security and Medicare programs as the Boomers continue to retire and age in retirement is enough to produce an almost $84 trillion national debt by the year 2047 in nominal dollars (not adjusting for inflation).
If the Fed carries through with raising interest rates by 3%, then the national debt in 30 years becomes $138 trillion instead of $84 trillion, which is an increase of $54 trillion.
Those results are based on a macroeconomic model, the core of which has been "reverse engineered" from the Congressional Budget Office Long-Term Outlook (CBO LTO), as described in the methodology notes linked here. It is simpler than that model, but captures the key components - and most importantly their interaction - in a way which allows for holistic scenario modeling.
The only difference between the $84 trillion national debt and the $138 trillion debt was changing one input - increasing the interest rate on the federal debt by 3%. Because of the weighted average life of the federal debt, it takes a while for this to become of major importance, but there is an eventual radical acceleration in federal deficits, which leads to an acceleration in interest payments on the debt, and an extraordinary increase in the size of the debt.
When the Fed released its results from the committee meeting, one more change was made to macroeconomic model - interest rates were increased by 3.25% instead of 3.0%.
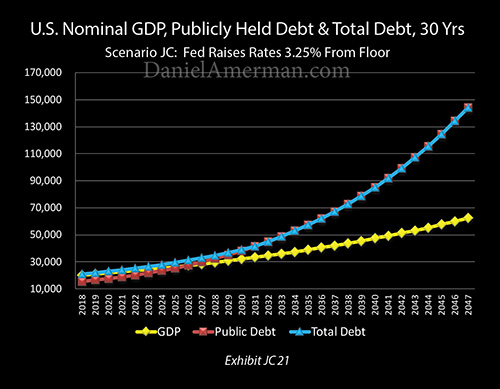
That single change of 0.25% was enough to produce Exhibit JC21 above, which shows the national debt now growing to $144 trillion in the next 30 years. This is an increase of $6 trillion above what the national debt would be with a 3% increase in interest rates and is a full $60 trillion above what the national debt would be if the Fed did not increase interest rates at all.
There are of course numerous simplifying assumptions involved in changing just one number and seeing what happens. As a starting point, the Fed does not directly determine the interest rates paid on the federal debt, and this is particularly true when we consider yield curves and the medium and long-term components of the federal debt. There is also the issue that the Fed "dot plot" in terms of the expectations of the committee members for future interest rate hikes is separate from the long-term expectations of the members.
However, the bigger issue is that we are coming into times of what are projected to be far higher deficits, far higher spending on benefit programs, and far higher national debts, to a degree that is historically unprecedented. Large national debts where the money is being borrowed to make interest payments have an acute exposure to higher interest rates, and as the debt grows this will become true to an extent that is historically unprecedented for the United States.
What is being shown herein are risks and constraints that simply did not used to exist, that few market participants are fully taking into account - but that are likely to become dominant market influences in the future.
A Surprising Increase In Compound Interest
While the implications of going from a 3.0% to a 3.25% increase in rates is almost shockingly negative for the national debt, there is a flip side - it is also almost shockingly positive for savers and investors who are building wealth over the long term.
In the analysis "The Wealth Machine That Rising Interest Rates Create" (linked here), we examined what the Fed's planned interest rate increases could deliver to investors over the long term. If someone had $100 invested in a very safe and high-quality portfolio that was delivering a 2.25% yield which was equal to the average interest rate on the federal debt, and that were to rise to 5.25%, then we get the blue and gold components of the graph below.
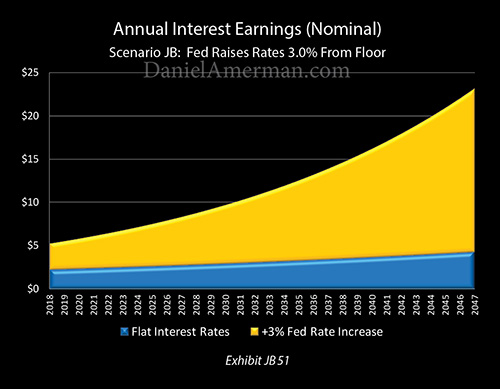
The blue zone is the annual increase in wealth with interest rates at their post-crisis lows. The gold zone is the annual interest earnings at 3% higher interest rates. The rapidly growing increase in wealth with the gold zone versus the blue zone is compound interest in action, that is interest earnings on interest earnings. The degree of increased wealth creation for savers and investors is stunning - and it has been missing since the financial crisis of 2008, as a result of Federal Reserve actions.
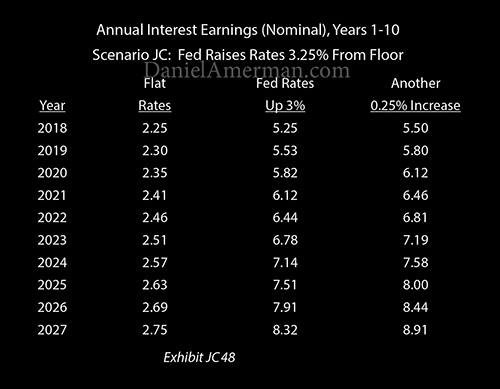
If we use that same methodology and include another 0.25% interest rate increase, going from 5.25% (the middle column) to 5.50% (the right column), then the initial impact is not very impressive. Our interest earnings are up by only 25 cents on the $100 investment in the first year, which seems fairly trivial.
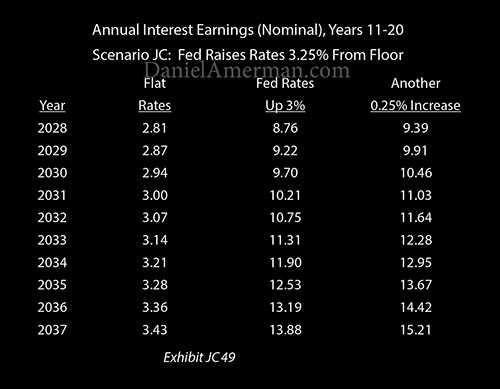
By the time we get 20 years out, the increase in earnings is becoming much more material as the extra 0.25% in yield is producing an extra $1.33 in annual earnings. Of that, $0.25 is the simple interest on our original $100 investment, and the $1.08 is the increase in earnings on interest earnings that is produced by investing at 5.50% instead of 5.25%.
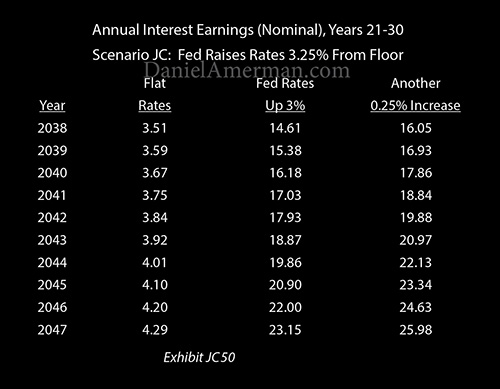
When we get 30 years out, then we get some true financial magic, to an extent that would surprise most people.
Our extra 0.25% in interest is producing an extra $2.83 in interest earnings. Of that, $0.25 is simple interest on our original investment, and $2.58 is additional interest earnings on interest earnings, aka compound interest.
Now, let's look at the base of the "Flat Rates" column. With 2.25% interest rates, annual interest earnings are $4.29, of which $2.25 is simple interest, and $2.09 is earnings on interest earnings.
Compound interest is the single most reliable creator of wealth over the long term, whether we are looking at reinvesting interest payments on bonds, or reinvesting dividend payments on stocks, or reinvesting net cash flow from real estate. And when we focus on the very heart of compound interest, which is earnings on earnings - our money truly doing the work for us - then moving 0.25% from a 5.25% rate to 5.50% rate is producing more annual income in 30 years than moving 2.25% from a 0% rate to a 2.25% rate.
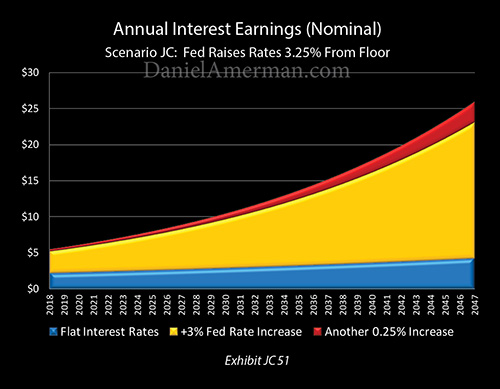
This can be seen visually in the graphic above, where the red area of the additional interest earnings with 0.25% higher interest rates has been added. Look at how much sharper the curve becomes a number of years out, and particularly notice the difference between how fast the blue area of interest earnings at 2.25% is growing, versus the red area of that mere 0.25% acceleration in the compounding of interest earnings.
For many people, it would likely seem as if this must be some sort of mistake. An interest rate increase of 2.25% is nine times as great as an interest rate increase of 0.25%. But yet, by the time we get 30 years out, the 0.25% increase from 5.25% to 5.50% is worth more in annual earnings on earnings, than the 2.25% increase from 0% to 2.25%.
The magic of compound interest is a nonlinear function. Which means it is non-intuitive for most people.
So, whether understood or not, if the median of the Fed interest rate increase predictions rising by 0.25% were to translate into actual average interest rates that were 0.25% higher, then for genuinely long-term investors it is far better news for building wealth than it likely appears.
As good as the move from 5.25% to 5.50% is, however, the move from 5.50% to 5.75% is even better. And the wealth that can be built in moving from 7.25% to 7.50% annual returns (in any investment) over the long term is truly wonderful.
Nonlinear Risks
Just as interest rate increases bring nonlinear returns for investors - they also bring nonlinear increases in risks for a heavily indebted nation that is borrowing the money to make interest payments on the national debt.
The Federal Reserve is currently contemplating a total of 13 individual 0.25% interest rate increases, of which 6 have already occurred, and something in the range of 7 more are expected before the end of 2020.
Those 13 increases are not of equal risk. Instead, because of the way interest on interest works, each one is riskier for the United States government over the long term than the one before it. And when the Fed added the expectation of 13th increase during the March 21st meeting - it was riskier than any of the increases before it. That is, if that increase does occur in practice and if it endures.
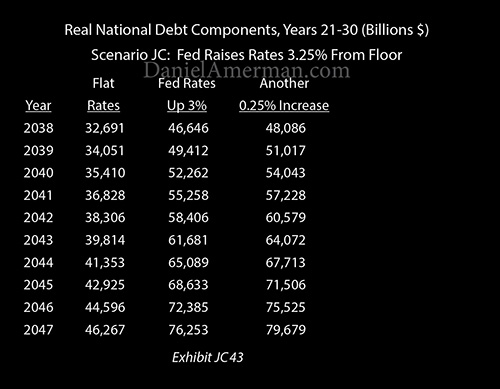
When we move from nominal dollars to inflation-adjusted dollars, then as shown above, the eventual increase in the debt is "only" $3.4 trillion - but that is still a huge sum.
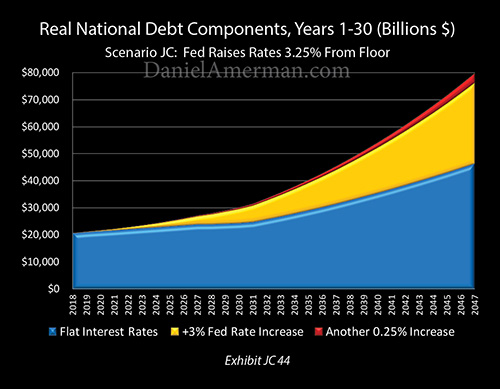
When we look at the real national debt in visual terms, we see something similar to what we saw when looking at the compounding of wealth for individual savers. The red area hardly exists for quite a while. But as interest has time to build on interest, then it becomes ever bolder. More ominously, that mere 0.25% increase is obviously changing the slope of the increase in the national debt by the time we get into the later years, feeding the speed with which the debt grows completely out of control.
The overall shape of the national debt graph is different than the saver graph, because of such considerations as Social Security, Medicare, and economic growth, as well being expressed in inflation-adjusted terms.
However, something the national debt shares with savers is that mathematically the time will come, all else being equal, when the 13th 0.25% interest rate increase will by itself be creating more annual interest expenses on interest expenses for the federal government (and taxpayers) than what would have been created by paying a full 2.25% interest rate on the total debt.
If we ever reach that place - which is quite unlikely.
Analysis With The Investment Implications Matrix
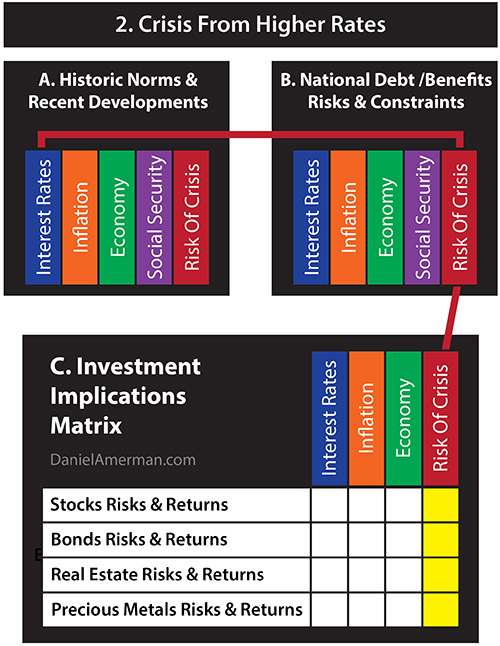
As shown in the "Investment Implications Matrix" above, the possibility of the Fed raising interest rates for a 13th time can be found in the "A" box of historic norms and recent developments. It is the norm for the Fed to use interest rates to try to exert control over the economy, and interest rates are still far below the historic norms of recent decades.
Something that is different is that the national debt is much higher than ever, and the nation has an unprecedented amount of Social Security and Medicare payments to make in the years to come. Taken together, the debt and benefits create historically unprecedented risks and constraints for the government and for the markets over the long term, as shown in the "B" box.
All else being equal if the Fed returns to more historically normal interest rates and leaves them there, paying interest payments on money borrowed to make interest payments will take a bad situation for the United States government and make it far worse over time.
The risk of a crisis will be larger, the size of the crisis may be larger, and the date on which the crisis occurs may move substantially forward in time. Again, all of those changes can happen when the Fed going about its normal business of trying to manage the economy through increasing interest rates runs into the historically unprecedented situation of the national debt and benefit promises.
If a major crisis occurs, it will, of course, impact all the major investment categories as shown in the "C" section, the Investment Implications Matrix.
If we look at the yellow matrix cell at the intersection of "Stocks Risks & Returns" and "Risk Of Crisis", then yes, a result of the Fed increasing interest rates could be a plunge in stock prices because of a financial crisis. If so, the financial security and quality of lives for tens of millions of retirees and retirement investors could be dramatically impacted - as a result of the Fed increasing rates.
Such an outcome is far from guaranteed, however. If high-interest rates trigger crisis, then they become a constraint, and historically abnormal low-interest rates - and low compounding of wealth - could instead remain for decades. That would change investment risks and returns in all the major asset categories, in a quite different way than crisis would as explored in the analysis linked here.
Another way of containing crisis from higher interest rates is to increase the rate of inflation, as covered in another analysis in this series. That would also change investment risks and returns in all the major asset categories, albeit in a quite different way than either crisis or low-interest rates.
The situation is fantastic. The future cannot be like the past. And that means that all categories of investments are likely to perform in different ways than they used to.
Disclosure: This analysis contains the ideas and opinions of the author. It is a conceptual and educational exploration of financial and general economic principles. As with any ...
more

