
If The Market Is In A Correction, How Severe Will It Be?
If the market is in a correction, how severe will it be? I have never been very good at determining price targets, but I think the moving averages are a good starting point. At the moment, the decline from the 50-day to the 200-day would be about a 5% decline.
That sounds about right to me in terms of a percentage decline. But I should mention that many of these corrections only give you a very brief window to take advantage such as early November.
It is really tough to buy at the lows because you really don't know that prices won't just keep going lower. To decide if the market is near a buying point, I like to look for significant spikes in the number of new 52-week lows, a spike in the VIX, and/or low levels of the bullish sentiment using the Investor's Intelligence Sentiment Survey.
(Click on image to enlarge)

The Leader List
Reminder: This list is my view of which ETFs are outperforming in the short-term. It isn't a recommendation to buy or sell. You have to decide for yourself.
I base this list on a number of factors, but primarily on the 50-day and relative strength. I am trying to buy into uptrends early and then let them ride until the trend has been played out.
Also, I think it is harder to decide when to sell than it is to decide when to buy. I don't mind buying as the price moves above the 50-day, but it seems to me that if you wait to sell when price moves below the 50-day, then you have given up too much of the gains.
At the moment, the market is under pressure and therefore most of the leaders are defensive. But sometime in the coming weeks, the market sentiment will swing back towards optimism, and the defensive issues will start to drop off as the cyclicals become leaders again. Hopefully, we'll take profits in these defensives and quickly take positions again in the cyclicals as they move up in price.
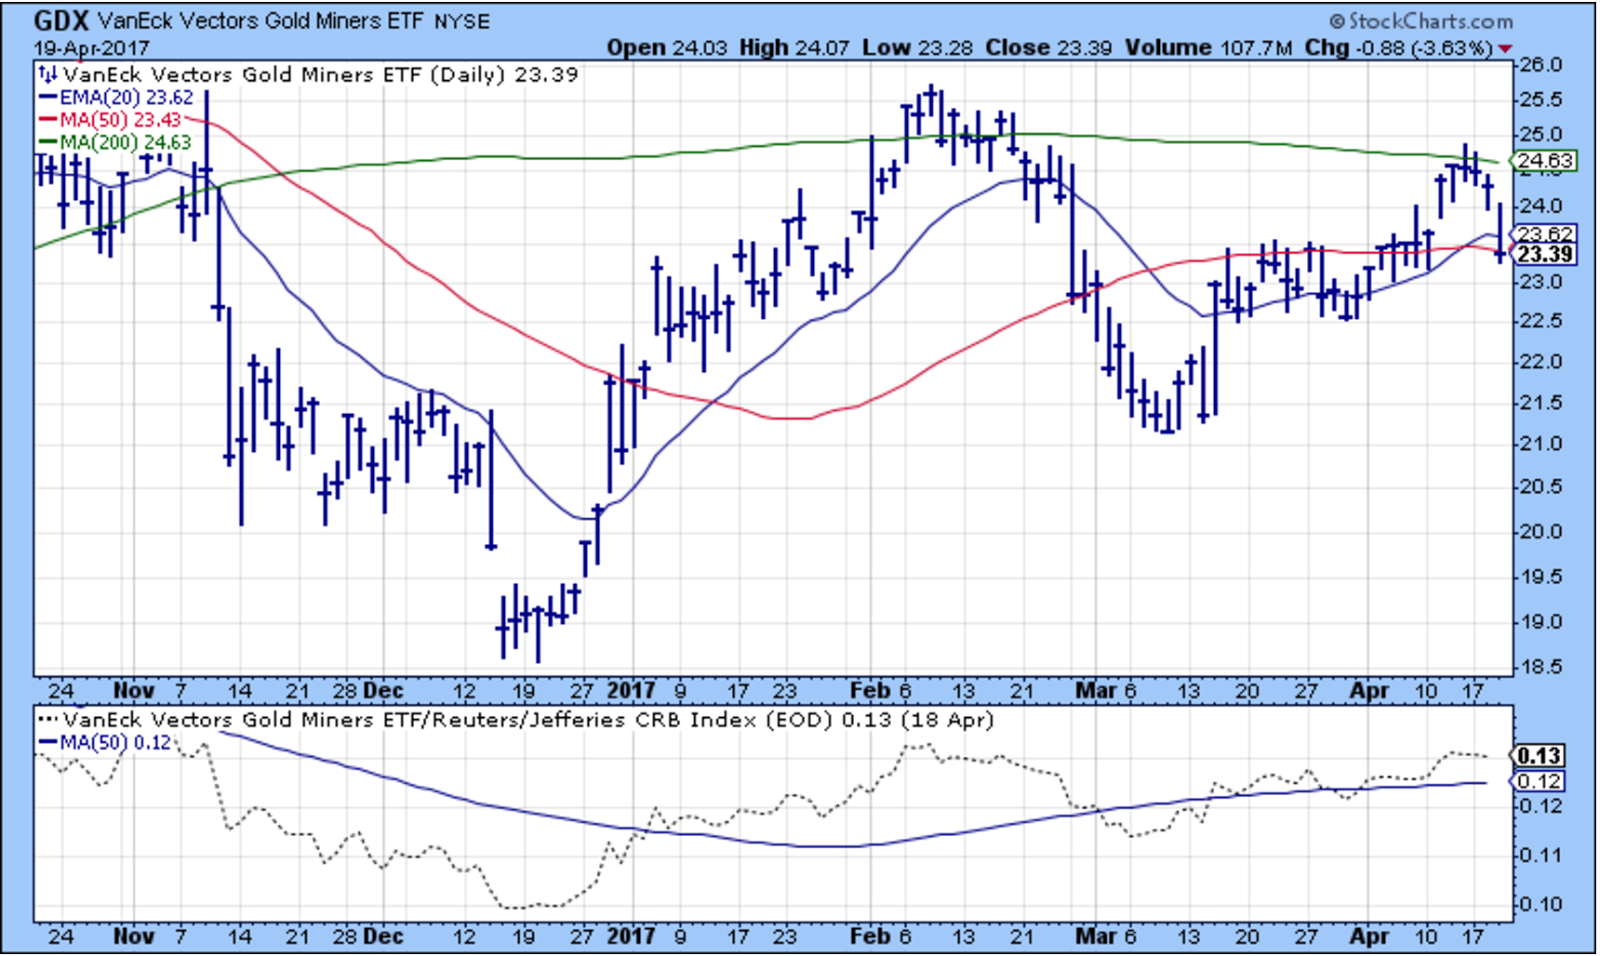
Gold Miners and Emerging Markets dropped off the leader list today.

Gold Miners didn't last very long on the leader list. The 50-day is under the 200-day, so the likelihood of failure was high.
The trend failed at the 200-day, closed under the 50-day and now it looks like a lower high?
It was probably a mistake for this to be on the leader list. It needed to clear the February high so that it had room to run higher. Arg!
(Click on image to enlarge)
This EEM chart looks a lot better. The longer-term trend still looks healthy, and the moving averages are properly aligned.
(Click on image to enlarge)

Outlook
The long-term outlook is positive.
The medium-term trend is down as of March 21
The short-term trend is down as of April 12
Disclaimer: I am not a registered investment advisor. My comments above reflect my view of the market, ...
more


A downturn in the market in the normal band of trading trend lines is not a correction. We will see if it manifests into a correction if it keeps declining. Even so, if it is, it seems to be a slow moving not particularly significant one so far.
The only really major change is the dollar weakness which has been visible after Trump's election which is not very good for the US.