
IBM Remains Number One On The Dow
Since we last presented the top Dow picks on November 17th, we see little turnover for our DOW top-ten list. IBM retains its top spot for the second-consecutive month. We only have three new stocks: Goldman Sachs, American Express, and Traveler's. Our newcomers replaced Johnson and Johnson, Intel, and Caterpillar.
Within our top-ten list, JPMorgan Chase and Verizon managed to move up a few spots. Cisco Systems, United Health, Wal-Mart, and Merck all declined a few positions.
Within the remaining eight unchanged components, Cisco, United Health, and JPMorgan Chase climbed up along with IBM. Johnson and Johnson, Intel, and Merck declined along with Verizon.
Also, be advised that once again we have no STRONG BUY-rated stocks in the DOW right now. Traveler's and Merck are currently rated as HOLDs by our models. The top-eight other DOW companies are BUY-rated stocks.
|
Ticker |
Company Name |
Market Price |
Valuation |
Last 12-M Retrn |
1-M Forecast Retn |
1-Yr Forecast Retn |
P/E Ratio |
Sector Name |
Nov. 17th, 2016 |
|
INTL BUS MACH |
168.51 |
11.83% |
23.97% |
0.81% |
9.68% |
12.50384 |
Computer and Technology |
IBM |
|
|
GOLDMAN SACHS |
239.93 |
35.44% |
36.01% |
0.74% |
8.85% |
15.18544 |
Finance |
||
|
JPMORGAN CHASE |
84.73 |
31.96% |
31.83% |
0.73% |
8.79% |
14.41804 |
Finance |
CSCO |
|
|
CISCO SYSTEMS |
30.46 |
5.01% |
14.99% |
0.58% |
6.97% |
14.16744 |
Computer and Technology |
||
|
VERIZON COMM |
51.63 |
5.43% |
13.60% |
0.58% |
6.95% |
13.21587 |
Utilities |
JPM |
|
|
AMER EXPRESS CO |
74.07 |
-4.04% |
7.61% |
0.52% |
6.21% |
12.63993 |
Finance |
VZ |
|
|
UNITEDHEALTH GP |
159.86 |
17.42% |
37.99% |
0.52% |
6.20% |
20.52996 |
Medical |
||
|
WAL-MART STORES |
71.34 |
13.42% |
18.13% |
0.48% |
5.77% |
16.00748 |
Retail-Wholesale |
||
|
TRAVELERS COS |
120.37 |
19.35% |
8.41% |
0.42% |
5.02% |
12.35409 |
Finance |
||
|
MERCK & CO INC |
61.8 |
20.96% |
18.39% |
0.42% |
4.98% |
16.29174 |
Medical |
NOTE: New stocks are in BOLD
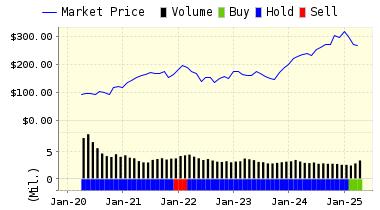
Below is today's data on American Express (AXP):
American Express Company is primarily engaged in the business of providing travel related services, financial advisory services, and international banking services throughout the world. American Express Travel Related Services Company, Inc. provides a variety of products and services, including, global network services, the American Express Card, the Optima Card and other consumer and corporate lending products, stored value products, and several others.
VALUENGINE RECOMMENDATION: ValuEngine continues its BUY recommendation on American Express for 2016-12-14. Based on the information we have gathered and our resulting research, we feel that American Express has the probability to OUTPERFORM average market performance for the next year. The company exhibits ATTRACTIVE Company Size and P/E Ratio.
|
ValuEngine Forecast |
||
|
Target |
Expected |
|
|---|---|---|
|
1-Month |
74.45 | 0.52% |
|
3-Month |
74.52 | 0.61% |
|
6-Month |
74.29 | 0.29% |
|
1-Year |
78.67 | 6.21% |
|
2-Year |
75.34 | 1.71% |
|
3-Year |
67.69 | -8.61% |
|
Valuation & Rankings |
|||
|
Valuation |
4.04% undervalued |
Valuation Rank(?) |
|
|
1-M Forecast Return |
0.52% |
1-M Forecast Return Rank |
|
|
12-M Return |
7.61% |
Momentum Rank(?) |
|
|
Sharpe Ratio |
0.39 |
Sharpe Ratio Rank(?) |
|
|
5-Y Avg Annual Return |
8.10% |
5-Y Avg Annual Rtn Rank |
|
|
Volatility |
20.70% |
Volatility Rank(?) |
|
|
Expected EPS Growth |
-6.71% |
EPS Growth Rank(?) |
|
|
Market Cap (billions) |
75.77 |
Size Rank |
|
|
Trailing P/E Ratio |
12.64 |
Trailing P/E Rank(?) |
|
|
Forward P/E Ratio |
13.55 |
Forward P/E Ratio Rank |
|
|
PEG Ratio |
n/a |
PEG Ratio Rank |
|
|
Price/Sales |
2.22 |
Price/Sales Rank(?) |
|
|
Market/Book |
3.61 |
Market/Book Rank(?) |
|
|
Beta |
1.25 |
Beta Rank |
|
|
Alpha |
-0.06 |
Alpha Rank |
|
ValuEngine Market Overview
|
Summary of VE Stock Universe |
|
|
Stocks Undervalued |
34.22% |
|
Stocks Overvalued |
65.78% |
|
Stocks Undervalued by 20% |
15.5% |
|
Stocks Overvalued by 20% |
33.93% |
ValuEngine Sector Overview
|
Sector |
Change |
MTD |
YTD |
Valuation |
Last 12-MReturn |
P/E Ratio |
|
-1.03% |
2.07% |
26.91% |
21.46% overvalued |
24.51% |
24.31 |
|
|
-0.10% |
2.85% |
13.72% |
21.38% overvalued |
14.60% |
19.24 |
|
|
-1.93% |
2.84% |
30.60% |
18.82% overvalued |
29.54% |
25.85 |
|
|
-0.84% |
2.34% |
16.90% |
16.26% overvalued |
14.64% |
18.06 |
|
|
-0.81% |
-1.04% |
11.89% |
15.61% overvalued |
14.68% |
19.59 |
|
|
-1.42% |
1.29% |
55.23% |
15.09% overvalued |
67.94% |
26.73 |
|
|
-1.13% |
1.85% |
36.45% |
14.64% overvalued |
25.58% |
20.39 |
|
|
-1.36% |
1.61% |
18.31% |
13.76% overvalued |
8.97% |
18.45 |
|
|
-0.92% |
1.11% |
21.44% |
12.24% overvalued |
11.73% |
29.69 |
|
|
-1.19% |
1.62% |
25.58% |
12.03% overvalued |
6.97% |
23.85 |
|
|
-1.18% |
1.43% |
4.57% |
10.28% overvalued |
8.14% |
23.80 |
|
|
-1.16% |
1.65% |
14.77% |
8.75% overvalued |
21.03% |
21.79 |
|
|
-1.69% |
1.85% |
12.64% |
8.35% overvalued |
23.38% |
14.77 |
|
|
-0.51% |
2.22% |
12.54% |
8.05% overvalued |
16.98% |
24.13 |
|
|
-1.10% |
1.68% |
9.48% |
5.62% overvalued |
8.94% |
23.92 |
|
|
-1.13% |
-0.56% |
-2.04% |
4.36% undervalued |
-7.61% |
27.78 |
Disclaimer: ValuEngine.com is an independent research ...
more

