
How To Get Exposure To Internet Stocks Through ETFs
The broad category Internet is still one of the fastest growing sectors in a world of relatively slow economic and corporate growth. Many of the stocks in this group are volatile and some are high-priced on a real dollar basis, making them pricey for the individual investor to buy more than a few shares or options on them.

Let's examine the current situation for exchange traded funds (ETFs) in regards to internet stock names, as ETFs often offer a lower share price with low expense fees, as well as options trading for leverage, diversification and strategy.
The most liquid 'pure' internet ETF is First Trust Dow Jones Internet Index Fund (FDN). This ETF trades around 600k shares a day volume (via etfdb.com), but its options still don't have a lot of open interest at this point in general (and the bid/ask spreads that are quoted by market makers on its options are fairly wide, although the 'real' market is likely narrower. Hopefully and likely the liquidity on FDN and other focused ETFs will grow over time, which will benefit retail investors & traders with smaller bid/ask spreads and better pricing and fills in general. The expense ratio of FDN is 0.53%, according to Yahoo Finance
The current top holdings in FDN as of 10/30/15 (from ftportfolios.com):
Amazon (AMZN) - 11.1% of assets
Facebook (FB) - 10.3%
Alphabet Class A (GOOGL) - 5.4%
salesforce.com (CRM) - 5.3%
Alphabet Class C (GOOG) 5.3%
Netflix (NFLX) 5.1%
PayPal (PYL) 4.7%
LinkedIn (LNKD) 4.3%
Yahoo! (YHOO) 4.2%
eBay (EBAY) 4.1%
These Top 10 holdings account for 50% of assets, and no other holding is above 3% of assets. If you combine the 2 Google Alphabet positions, the biggest 3 holdings of AMZN, FB, GOOGL/GOOG account for 32% of the ETF, a fairly large concentration in just 3 names. Something to be aware of if you invest or trade in this security. Expense ratio is 0.53%, according to Yahoo Finance.
Other internet ETFs include Global X Social Media Index ETF (SOCL) and PowerShares Nasadaq Internet Portfolio ETF (PNQI), Both of these do also have options trading available on them, however the underlying volume is low -- which may make the options rather illiquid, so proceed with caution on those at this time. They do have different holdings in their largest positions, so will likely offer a different performance than FDN. For example, the 4th largest holding in PNQI is Priceline (PCLN) -- while SOCL holds Chinese, Russian & Japanese internet stocks among its largest allocations, such as Tencent Holdings (TCEHY), NetEase ADR (NTES), Nexon (NEXOF), Sina (SINA) and Yandex (YNDX).
There is also an ETF with options trading available that purely focuses on China internet stocks -- again, however, it is not super liquid on the underlying volume, so be cautious and use limit orders -- it is KraneShares CSI China Internet ETF (KWEB). Alibaba (BABA) is the top holding of this ETF at 10% of assets in the latest reporting from 10/30/2015 (via kraneshares.com).
Let's take a quick look at these 4 ETFs from a performance standpoint. Below we compare FDN, SOCL, PNQI and KWEB compared to the S&P 500 ETF (SPY) and Nasdaq 100 ETF (QQQ) on a year-to-date basis:
2015 Relative Performance Chart
Click on image to enlarge
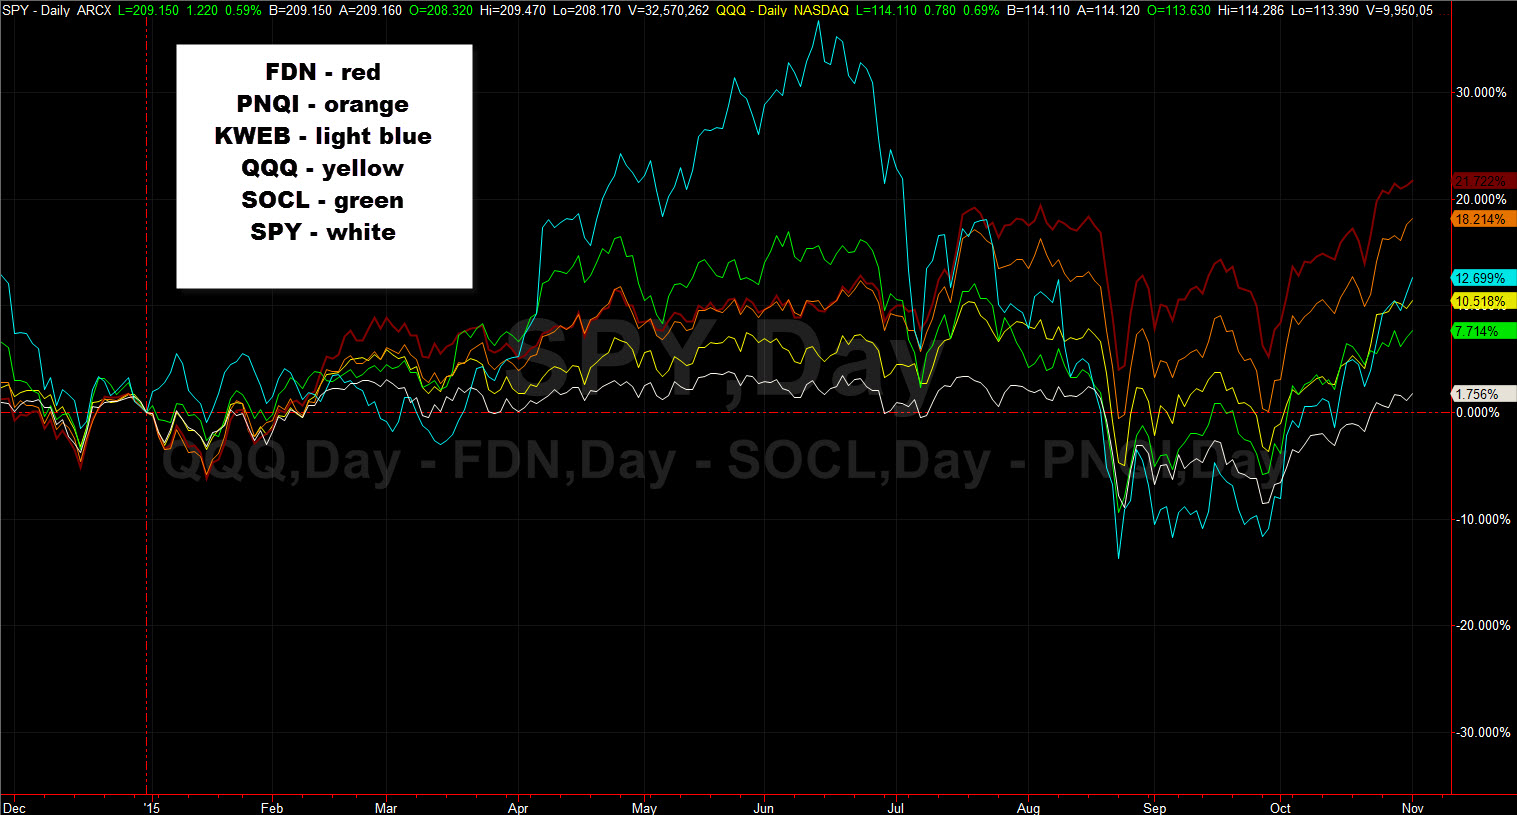
Chart created with TradeStation
You can see that FDN is the leader of the group, with PNQI not too far behind. Both of these are nearly doubling the gains of QQQ this year. KWEB is clearly the most volatile of this group, with large swings up and down. SOCL is a laggard in 2015, trailing behind the 'Qs'.
Beyond these pure sector plays, you can also get exposure to big Internet names through other ETFs, often ones you might not think of or expect at first. The following data is from ETFDB.com, which has a nice function that can search and sort for this type of thing.
If you take Amazon (AMZN) for example, it is 12.5% of Market Vectors Retail ETF (RTH) and 8.9% of SPDR Consumer Discretionary ETF (XLY). Those are fairly large allocations in non-tech ETFs. Facebook (FB) is 5.2% of SPDR Technology ETF (XLK) and 5.0% of PowerShares Dynamic Media ETF (PBS).
Two of the biggest and most well-known technology-related ETFs have holdings in internet names, as one would expect:
PowerShares Nasdaq 100 ETF (QQQ) Top 10 Holdings (as of 10/30/15, data from Morningstar)
Apple (AAPL) 12.8%
Microsoft (MSFT) 8.0%
Amazon (AMZN) 5.5%
Alphabet Class C (GOOG) 4.6%
Facebook (FB) 4.4%
Alphabet Class A (GOOGL) 4.0%
Intel (INTC) 3.0%
Gilead Sciences (GILD) 3.0%
Comcast Class A (CMCSA) 2.5%
Amgen (AMGN) 2.3%
SPDR Select Technology Sector (XLK) (as of 10/30/15, data from SPDR):
Apple (AAPL) 16.0%
Microsoft (MSFT) 9.9%
Facebook (FB) 5.4%
Alphabet A (GOOGL) 5.0%
Alphabet B (GOOG) 4.9%
AT&T (T) 4.8%
Verizon (VZ) 4.5%
Visa (V) 3.5%
Cisco (CSCO) 3.4%
Intel (INTC) 3.2%
Disclosure: None.


