
How Serious Is The Sell-Off In Apple And Where Might It Be Going?
- A longer-term top (correction to at least May/June 2018) appears to be underway.
- Shorter-term support levels are identified from daily charts.
- An eventual corrective low around roughly $142 to $134 is identified.
Since hitting a high of $180.10 two weeks ago Apple Inc. (AAPL) has fallen a little more than 11% as of last week’s $160.10 low. The decline has taken the stock through multiple potential support areas without much hesitation, including the $166.46 low of a six-week trading range, the prior $164.94 peak from late-August, and a long-term uptrend line as seen on the enclosed daily chart.
The importance of the recent rapid decline looks to be connected to significant resistance indicated at the 5/7 concentric circle as illustrated on the monthly chart below at point B.
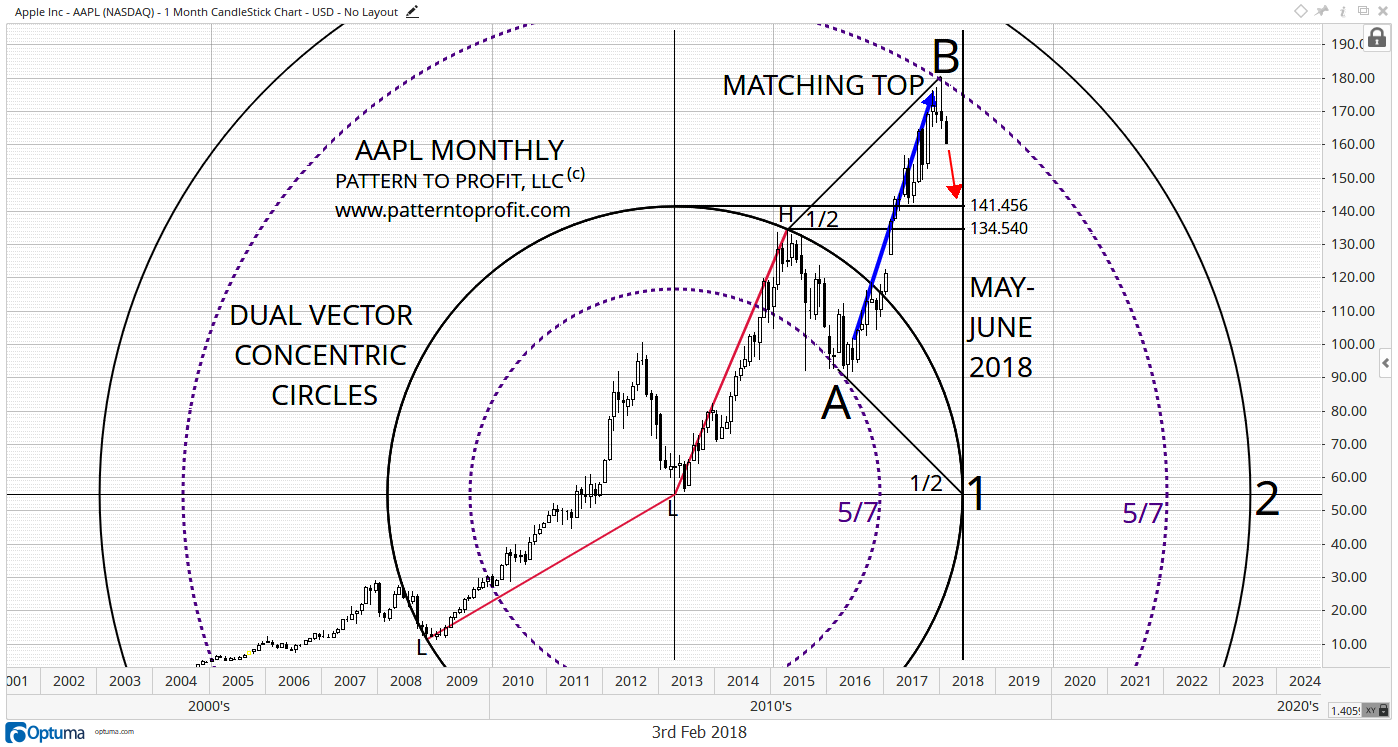
Dual Vector Concentric Circles (L to L, L to H) give matching support and resistance for the low of $89.47 in May 2016 (point A) and last month’s market resistance, and also yields a related price/time target area:
- 45o angles from the second vector high (‘H’) and the circle’s extreme right point (‘East’) identify A & B.
- 5/7 concentric circles also link points A & B.
- Potential support areas are $141.47 (circle top), and $134.54 from the vector high (‘H’).
- The main circle (‘1’) extreme right point in time is May/June 2018 (thick black vertical), which indicates selling pressure may dominate for three to four months.
A decisive drop below the three-month low of $164.70 (January low) provided a clear bearish signal w ith price then falling away from monthly concentric circle resistance at $179.60, thereby increasing the odds for a multi-month decline.
On a shorter-term daily view as seen in the below chart, the market also broke below a major trend line with three consecutive daily attempts to close back above it last week, which subsequently failed on Friday. Target price levels for support are given below using the distance from the all-time high to the trend line:
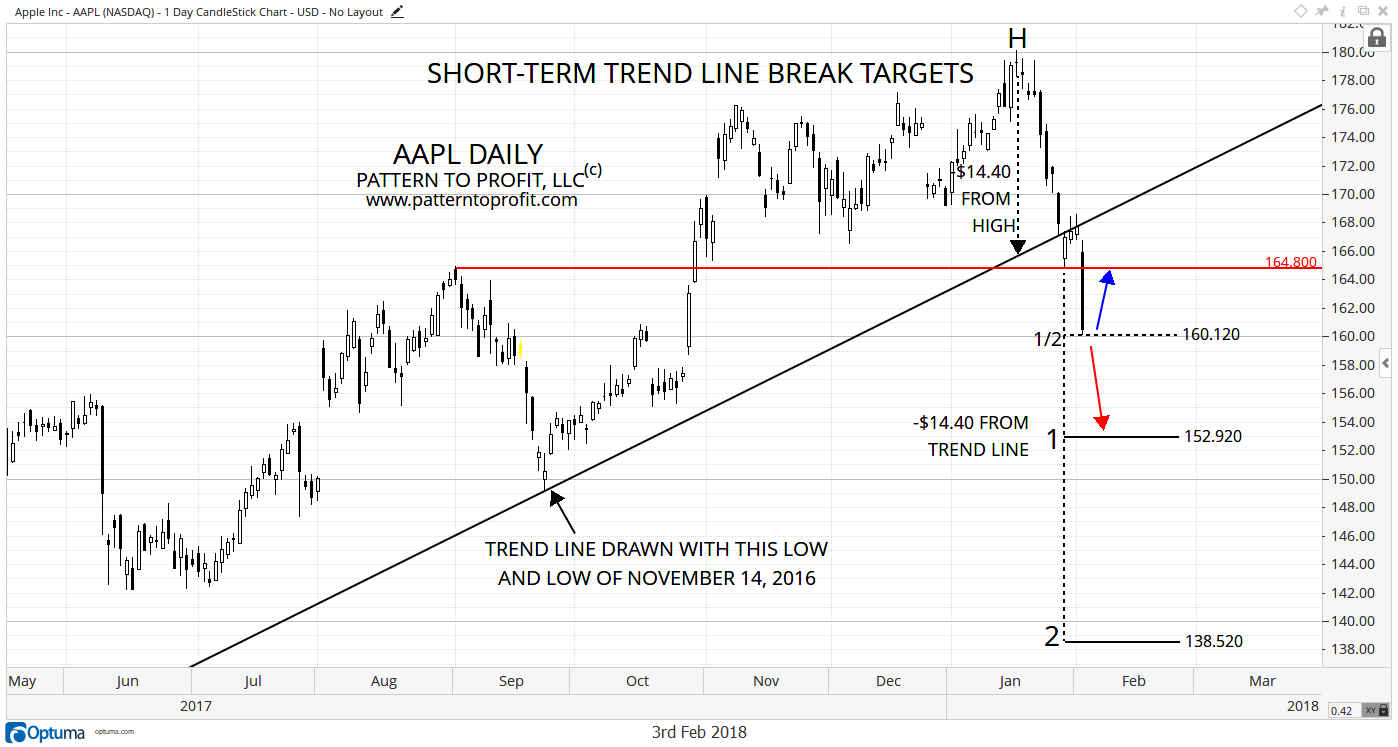
- Friday’s low of $160.23 was a mere 11 cents above the half level of $160.12.
- A bounce at this half level is expected to be a very short-term rally, with resistance anticipated at prior support around the $164.80 level (blue arrow) from a preceding high (red horizontal).
- The full price target of $152.92 (‘1’) is expected to offer strong support. At the same time a break below this price level is a severe bearish signal.
- Given the larger uptrend reversal indicated from the monthly analysis, the 2nd price level of $138.52 is also not an unreasonable final low for the current correction. (Note the rough alignment with the monthly support price targets of $141.47 & $134.54.
(Trend line break measuring objective is derived from taking the high straight down to the trend line, then subtracting that value ($14.40) from the trend line at the breakout (breakdown) price level.)
Moving on to the next chart below, which incorporates cumulative averages, we see the following:
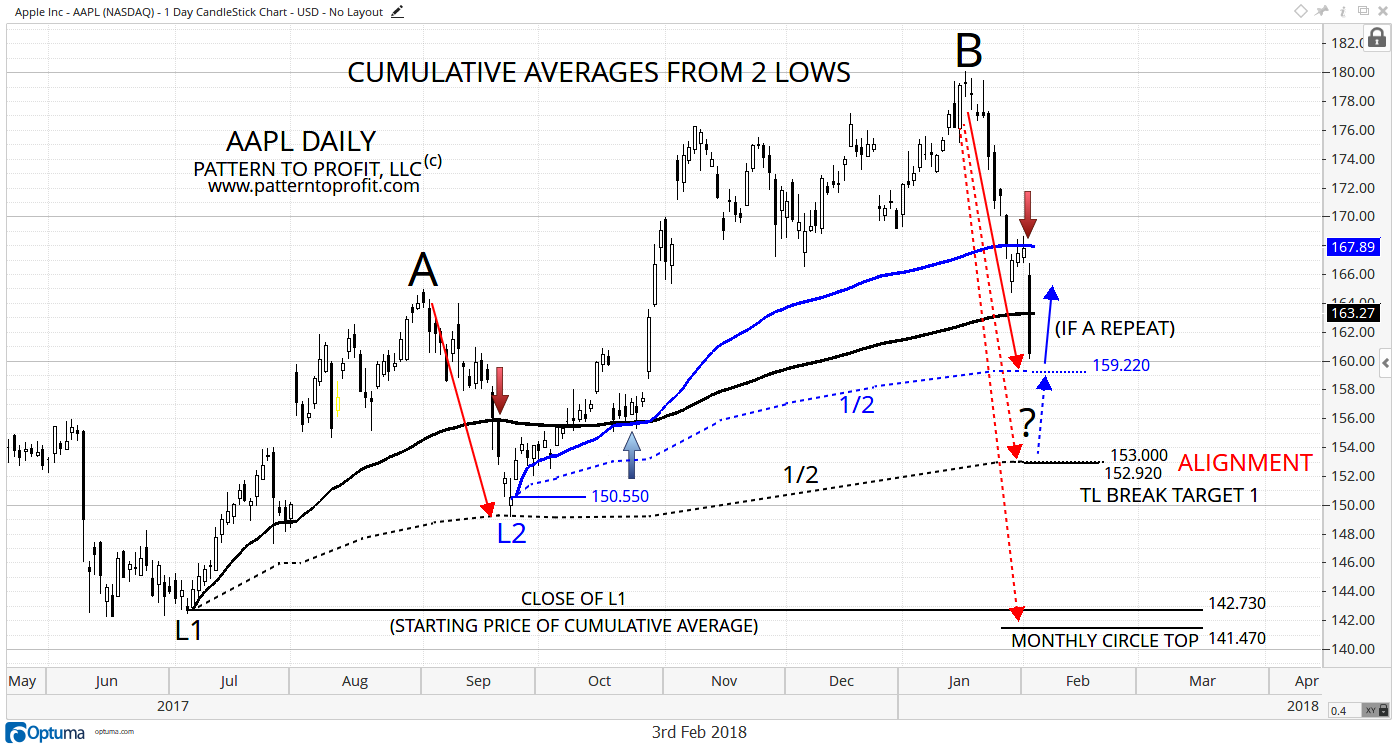
- Apple met strong resistance (thick red arrow) on its most recent bounce around the cumulative average from the low at L2 (blue average).
- Potential support at the $163.27 cumulative average (black) was exceeded to the downside last Friday without hesitation. Therefore, Apple next targets the lower cumulative 1/2 average (blue dashed) at the $159.22 price area. This level, combined with the all-time high (B), offers a repeat (thin solid red arrows), of the prior larger correction from the high at A to the low L2 right on the 1/2 average (black dashed).
- However, the close alignment of the 1/2 average from L1 (black dashed) of $152.92 with target level ‘1’ of $153.00 (from the trendline analysis/previous chart) offers a stronger potential for a short-term bottom area.
- The first monthly support target price of $141.47 sits just underneath $142.73, the close of L1. (This closing price begins the calculation of the cumulative average from L1.) This rough alignment lends credence to this monthly support target price for a potential major reversal back up, and an end to the current correction.
Disclosure: Pattern to Profit, LLC, any affiliates or employees or third party data provider, shall not have any liability for any loss sustained by anyone who has relied on the information ...
more

