
How Concerning Are These 7 Bad Signs For Stocks?
Scary Things About The Stock Market
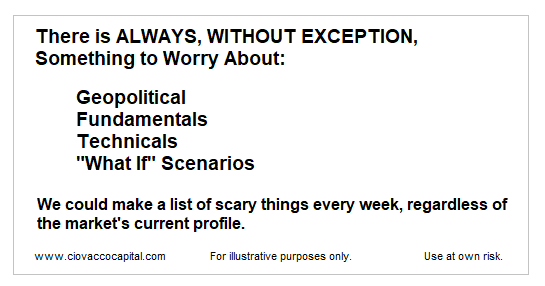
There is never a perfect time to invest in the stock market. There is always something concerning on the technical, fundamental, and political fronts…. always. There are many “reasons stocks are in big trouble” lists floating around in 2017, including 7 signs the stock market is ready to run smack into a wall.
Let’s Examine The Bullish Side Of The Argument
Given the article outlines logical and rational bearish arguments, our objective is not to criticize the “7 signs” MarketWatch piece, but rather to provide an alternative, longer-term view.
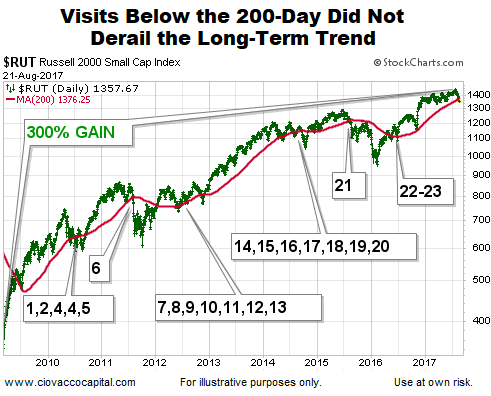
Small Caps Drop Below 200-Day
How concerned should we be that the Russel 2000 Index dropped below its 200-day moving average? Since the S&P 500 bottomed in March 2009, small caps have dropped below their 200-day 23 other times. Despite the 23 pieces of bearish evidence, small caps have gained more than 300% over the same period. In the chart below (2009-2017), the Russell 2000’s 200-day moving average is shown in red.
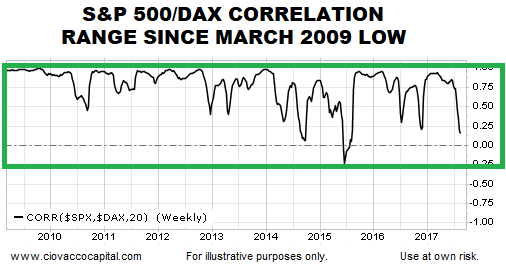
Correlation Breakdowns
How concerning is the present-day correlation between the S&P 500 and the German DAX? The chart below shows the correlation between the U.S. stock market and German stock market dating back to the major bottom in equities that occurred in March 2009. Notice how the present-day correlation remains in the same range that it has been in since March 2009; a bullish period for stocks. Is it possible a weaker correlation could be followed by a pullback in the S&P 500? Sure, but in each case since March 2009, the S&P 500 went on to post a new high (it did not derail the long-term trend in stocks).
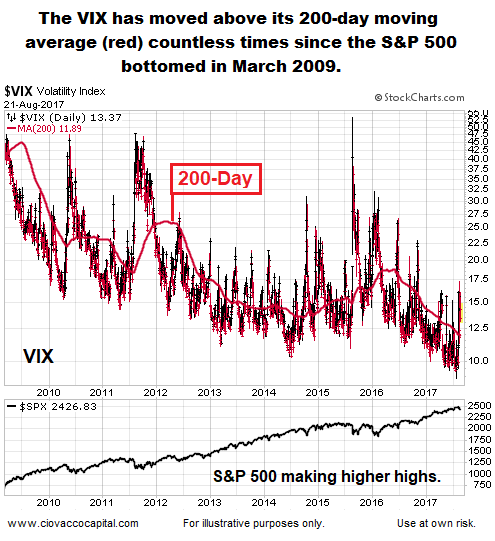
VIX Pops Above 200-Day
How concerning is it when the VIX Fear Index moves above its 200-day moving average? The chart below shows the VIX since March 2009; its 200-day is in red. The S&P 500 is shown below for comparison purposes.
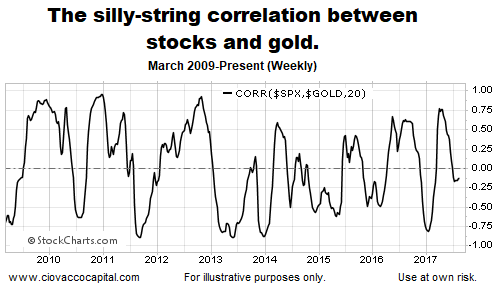
Gold’s Rally
When gold is moving higher, does that mean stocks will move lower? The long-term correlation between the S&P 500 and gold is all over the place (see below). Sometimes gold zigs and the S&P 500 zags; other times gold zigs and the S&P 500 zigs in unison. In short, gold is not a reliable tool to monitor the long-term health of the stock market.
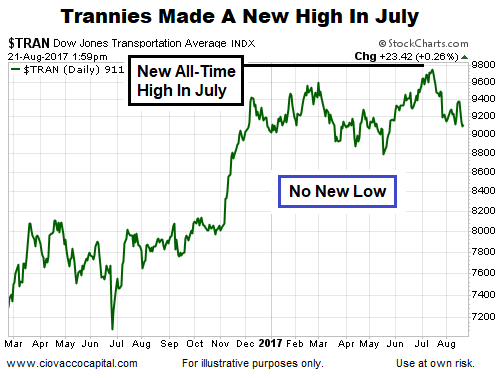
Transportation Weakness
Given the Transportation Average made a new all-time high in July, it may be too early to say much about the current pullback in terms of the longer-term trend. Since making the new all-time high, no significant new low has been made.
Hindenburg Omen/Market Breadth
Regarding the often cited as bearish evidence Hindenburg Omen, Barron’s sums it up this way:
“Don’t freak out just yet. The Omen does not have a very good track record for being right.”
Trump Agenda
While it is possible the lack of progress in Washington may be starting to weigh on the markets, it has not shown up on the long-term charts yet, as outlined in detail in this week’s video. The video compares the tops in 2000 and 2007 to August 2017.
Long-Term Means Long-Term
The well-written MarketWatch article lays out some legitimate concerns; however, most of them speak to increasing odds of a possible short-term stock market pullback/correction, rather than a major trend change/new bear market.
The issues above could spill over into the longer-term charts, meaning it is always important to remain flexible and open to all outcomes, including wildly bearish outcomes. We will be monitoring the evidence day by day with an open mind.
Disclosure: This post contains the current opinions of the author but not necessarily those of Ciovacco Capital Management. The opinions are subject to change ...
more

